By Ryan Hamnett, PhD
Flow cytometry is a versatile technique that uses light to characterize and measure heterogenous suspensions of particles, typically cells, based on their physical characteristics and expression of cellular markers.
Antibodies are typically used to bind to specific cell surface markers to define cell populations, though flow cytometry can also be used for intracellular staining such as cytokine content and phosphorylation events. Flow cytometry can process thousands of particles per second, making it the technique of choice for research and diagnostic tests that require rapid measurements of multiple parameters for a mixed cell population.
Through a combination of light scatter and fluorescence, flow cytometry can provide measures of cell size, volume, live/dead discrimination, and numbers or percentages of specific cellular subtypes within a mixed population. Cell sorting, also known by the tradename fluorescence-activated cell sorting (FACS), is a special application of flow cytometry in which specific cell populations are isolated and retained for downstream culture or analyses.
This guide aims to provide an overview of flow cytometry experimental design, important controls, protocols, and troubleshooting.
Numerous discoveries in the late 19th and early 20th centuries were necessary for the development of flow cytometry. These include the observations of Paul Ehrlich in the 1880s, who used dyes to identify different types of leukocyte,1 the conjugation of fluorophores to antibodies by Coons in 1941 to detect Streptococcus pneumonia,2 and the development of monoclonal antibodies by Köhler and Milstein.3
The work of Moldovan in 1934 described a microscope that could count cells by detecting the movement of a cell suspension through a capillary glass tube, the passage of which was detected by a photoelectric device attached to the eyepiece.4 This design was improved upon by Crosland-Taylor in 1953 with a process termed hydrodynamic focusing, which is essential in modern flow cytometers.5 The cells were injected into the center of a faster flowing fluid, which forced them into a single stream using the principle of laminar flow, making counting more reliable and reducing the likelihood of clogging.
Being able to measure the size or volume of particles in a flow stream is a core aspect of flow cytometry. This came in the 1950s with the Coulter principle, which determines cell size by drawing cells through an aperture to disrupt an electrical current. Cells produced an electrical pulse proportional to their volume.6 Fulwyler took this principle and used it to sort cells by size by separating them into drops and imbuing them with an electric charge, based on recently developed inkjet printer technology.7 Around the same time, Katmentsky et al. developed a sorter using blue light scatter for size and UV absorption for nucleic acid content.6
The first fluorescence-based cytometers and sorters were created by Dittrich and Göhde who made the Impuls cytophotometer (ICP) instrument in the late 1960s, while Herzenberg et al. designed (1960s) and later patented (1972) the first fluorescence-activated cell sorter (FACS) machine.6,8 Of note, Herzenberg et al. were among the first to use fluorescently tagged antibodies to target live cell populations, in what is now standard practice in flow cytometry experiments.9
Flow cytometry and cell sorting have since become standard tools in academic and clinical laboratories. Highly multiplexed experiments are possible by using more antibodies, fluorophores, laser lines, and computational power, allowing researchers to detect a huge array of different cell types. Cytometers today can detect up to 40 different colors at once.
Flow cytometry benefits from many advantages over or in common with other techniques that can be used to characterize diverse cell populations, such as immunohistochemistry (IHC) or immunocytochemistry (ICC).
Flow cytometry is a versatile technique for measuring a large number of cellular characteristics as well as cellular activity. Physical attributes that can be measured by flow cytometry include cell size, surface area, contents of the cell (such as granularity of immune cells), and stage of cell cycle. Cellular activity can be analyzed by measuring the amount of signaling molecules within the cell, phosphorylation state of target proteins, and calcium flux. A standard use of flow cytometry is also to simply count cells, whereby different cells are identified through expression of specific markers. This can be highly informative for immune cells in particular, the proportions of which can change dramatically in different disease states.
Some common uses of flow cytometry are indicated below:
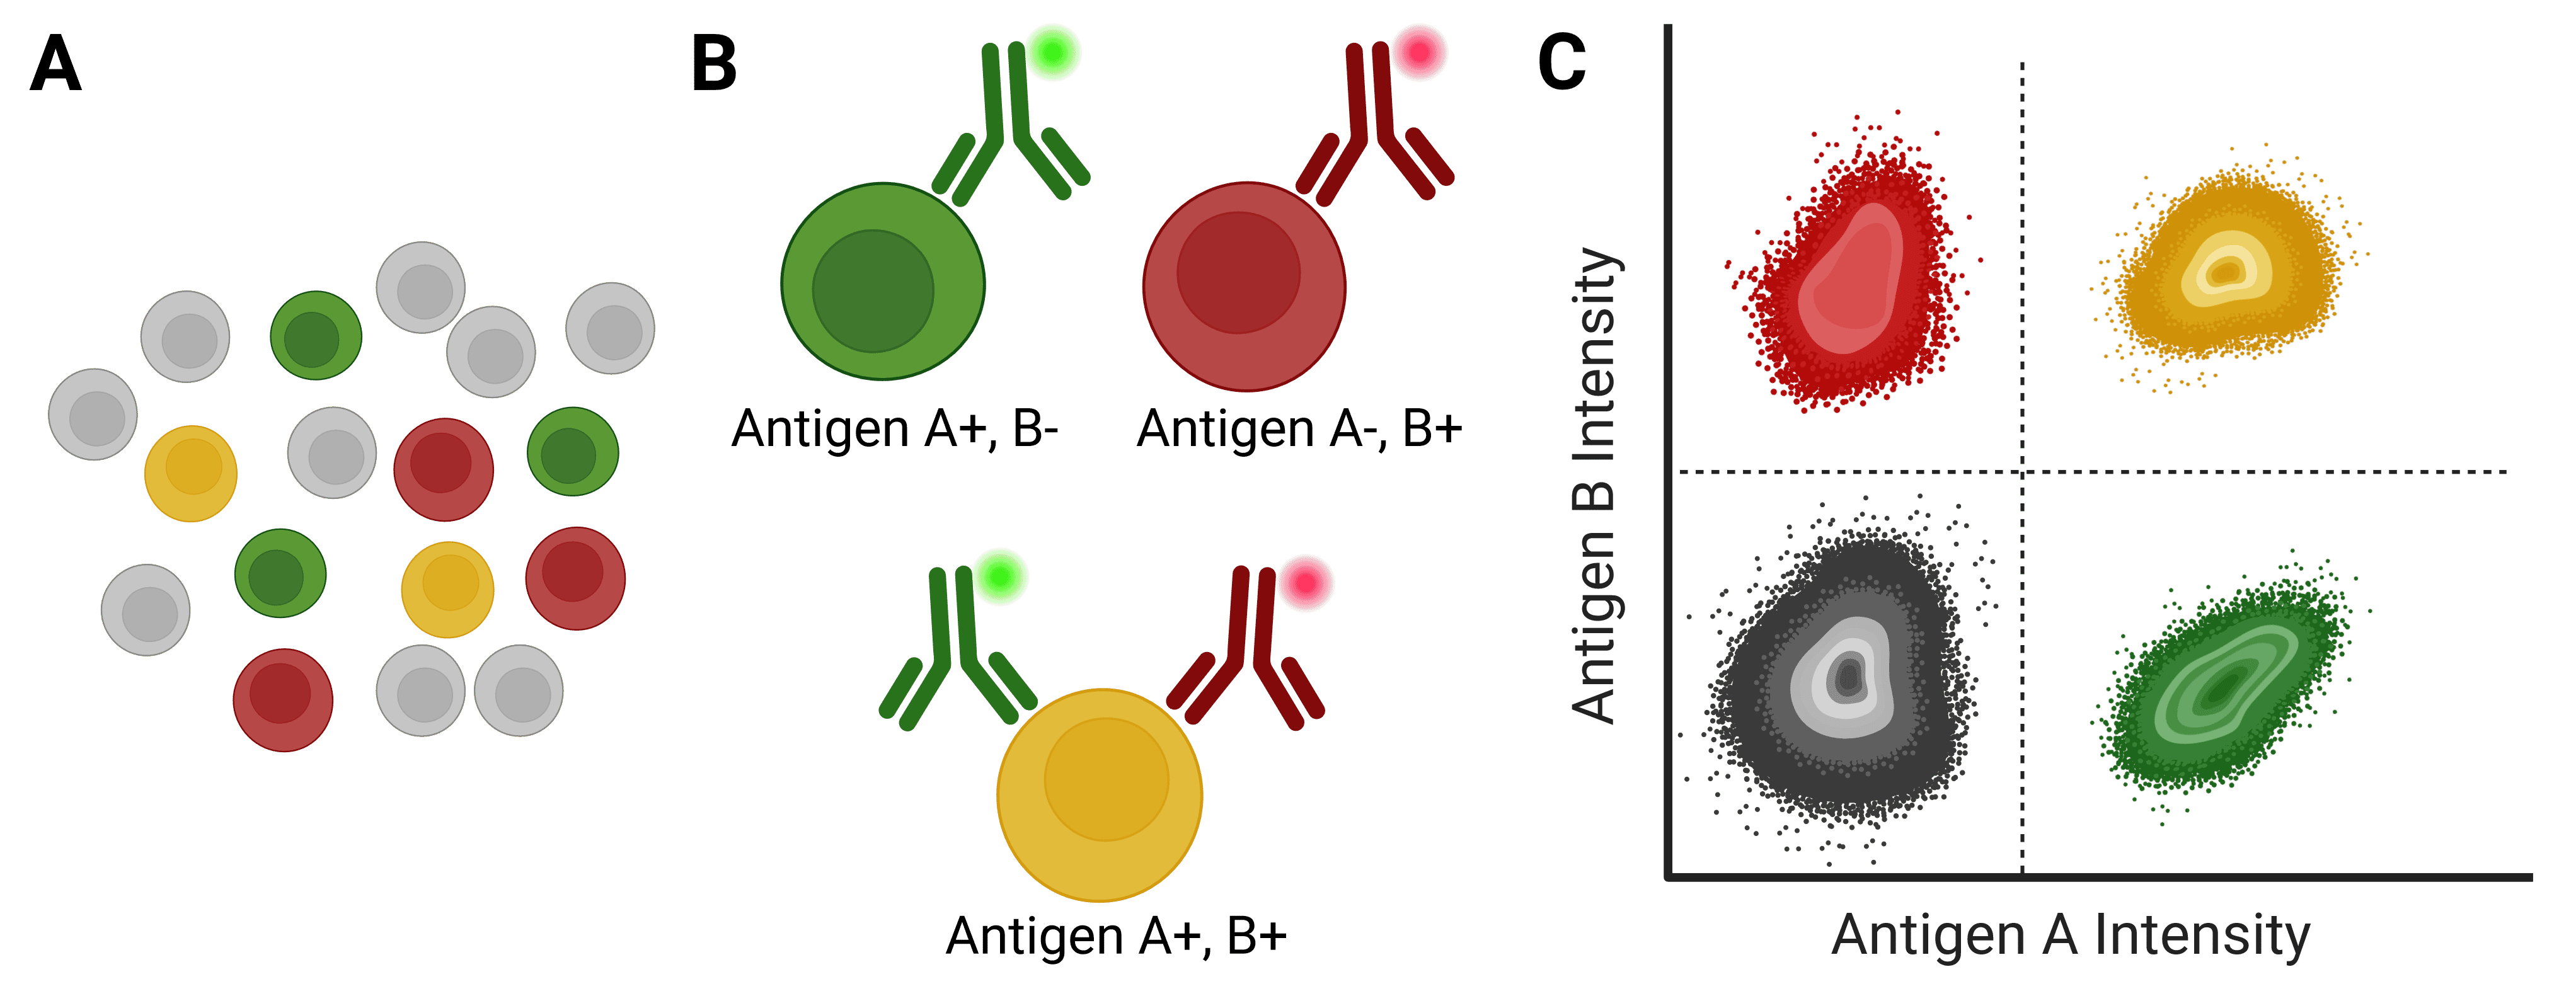
Figure 1: Immunophenotyping with flow cytometry. A, A mixed population of cells, which may be distinguished by the expression of different antigens on their cell surface. B, Antibodies directly conjugated to fluorophores can identify specific cell types based on antigen expression. C, Flow cytometry analyzes and identifies cell populations based on fluorescence intensity following antibody binding.
Cell Sorting and FACS
Cell sorting is a special application of flow cytometry used to separate or “sort” cell populations of interest into two or more containers for other downstream applications. Not all flow cytometers can sort cells, so cytometers can be divided into analyzers and sorters. Fluorescence-activated cell sorting (FACS) is a tradename of BD, though all cell sorters work on the same principles and use fluorescence to separate cell populations.
As with standard flow cytometry, the cells pass a light source in single-file, and their characteristics (expression of a target protein or fluorescent protein, size etc.) are measured. Based on these characteristics, the droplet containing the cell is given a charge that allows it to be deflected by electromagnetic fields into a container of choice. Sorting is useful for isolating a specific population for sequencing (e.g. RNAseq) or culturing, such as stem cells or neurons.
See Cell Sorting for more information on how sorting and FACS work.
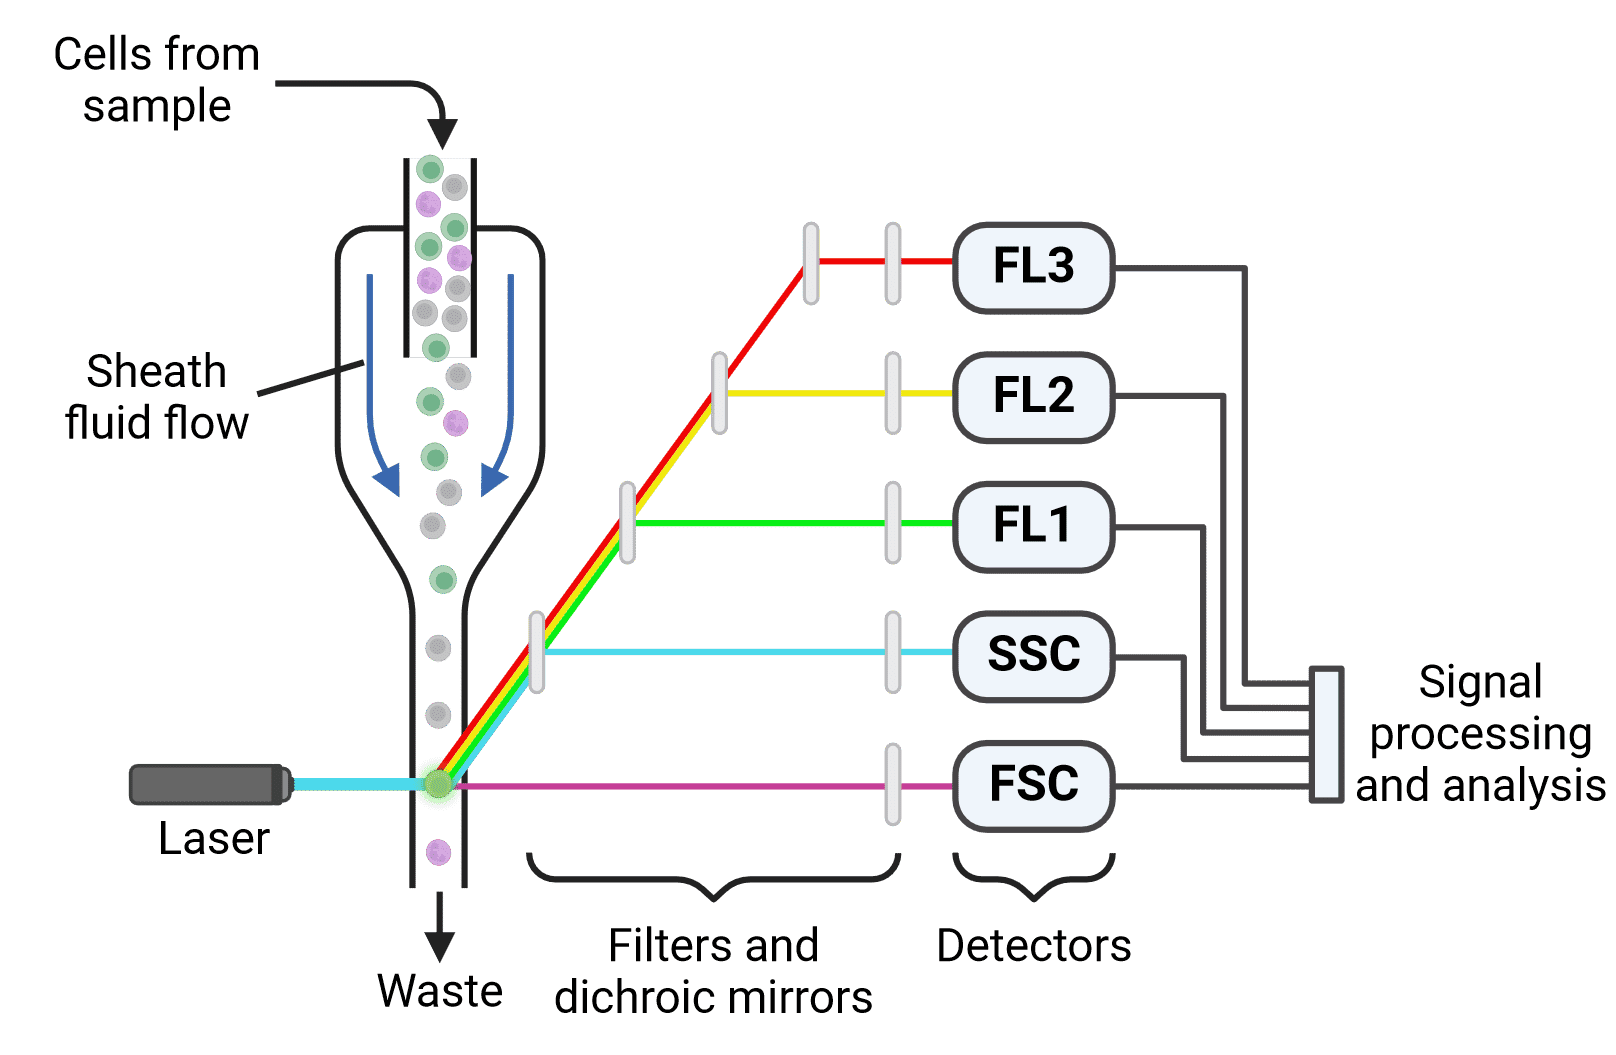
Flow cytometers have three main components (Figure 2):
Figure 2: Schematic of a multicolor flow cytometer. Cells are focused into a single stream by hydrodynamic focusing. Laser illumination results in both scatter (forward (FSC) and side scatter (SSC)) and fluorescence. Light is directed to the appropriate detectors by dichroic mirrors and filters. Following detection, emitted signals must be processed and analyzed.
In addition to the above components, cell sorters have electromagnetic plates for sorting cells, which will be covered in Cell Sorting.
Fluidics
One of the key benefits of flow cytometry is that it can measure attributes of single cells at an extremely high rate. To make this possible, cells must move through the flow cytometer in a single file stream. This means that when the cells reach the interrogation point at which they intersect with the laser, only one cell will be positioned in the center of the laser to be illuminated and measured. This is achieved and controlled by the fluidics system.
Hydrodynamic Focusing
Instead of forcing the cells into a single file stream by making an extremely narrow tube, the walls of the sample ‘tube’ are made of another liquid called the sheath fluid. The sample is injected into the core of the flow chamber (called a flow cell or nozzle tip), enclosed by the sheath fluid. The fluidics that regulate the sheath fluid and sample fluid are designed to maintain consistent and predictable laminar flow conditions, meaning that the sheath and sample fluids will not mix. Instead, the fast flow of the sheath fluid and the gradual narrowing of the sample core accelerate the cells and restrict them to the center of the core. This process is called hydrodynamic focusing, and results in a single file stream of aligned particles by the interrogation point (Figure 2).
In some instances, it may be desirable to alter the width of the sample stream, for example to achieve a greater flow rate and therefore increase the speed of the experiment. This can be done by increasing the pressure of the sample fluid relative to the sheath fluid pressure (though the sample pressure is always greater than the sheath fluid pressure). A wider stream will allow more cells to enter the flow cell at any given moment. This will result in lower resolution data as more cells meet the laser off-center or simultaneously, but this may be acceptable for some applications such as immunophenotyping. It will not be suitable for applications that require high resolution data such as DNA content analysis.
Acoustic Focusing
Acoustic focusing or acoustic-assisted hydrodynamic focusing is an enhancement to traditional hydrodynamic focusing that uses sound vibrations to improve centering of cells in the flow stream. This means that regardless of sample volume in the flow cell, particles will be optimally illuminated and detected, facilitating higher flow rates without compromising precision.
Fluidics Stability
A stable fluidics system in a flow cytometer ensures that cells move through the system quickly and consistently, allowing researchers to collect high quality, reliable data. Stability is provided primarily by the laminar flow described above, which causes each cell to be aligned centrally and spend the same amount of time being illuminated by the laser.
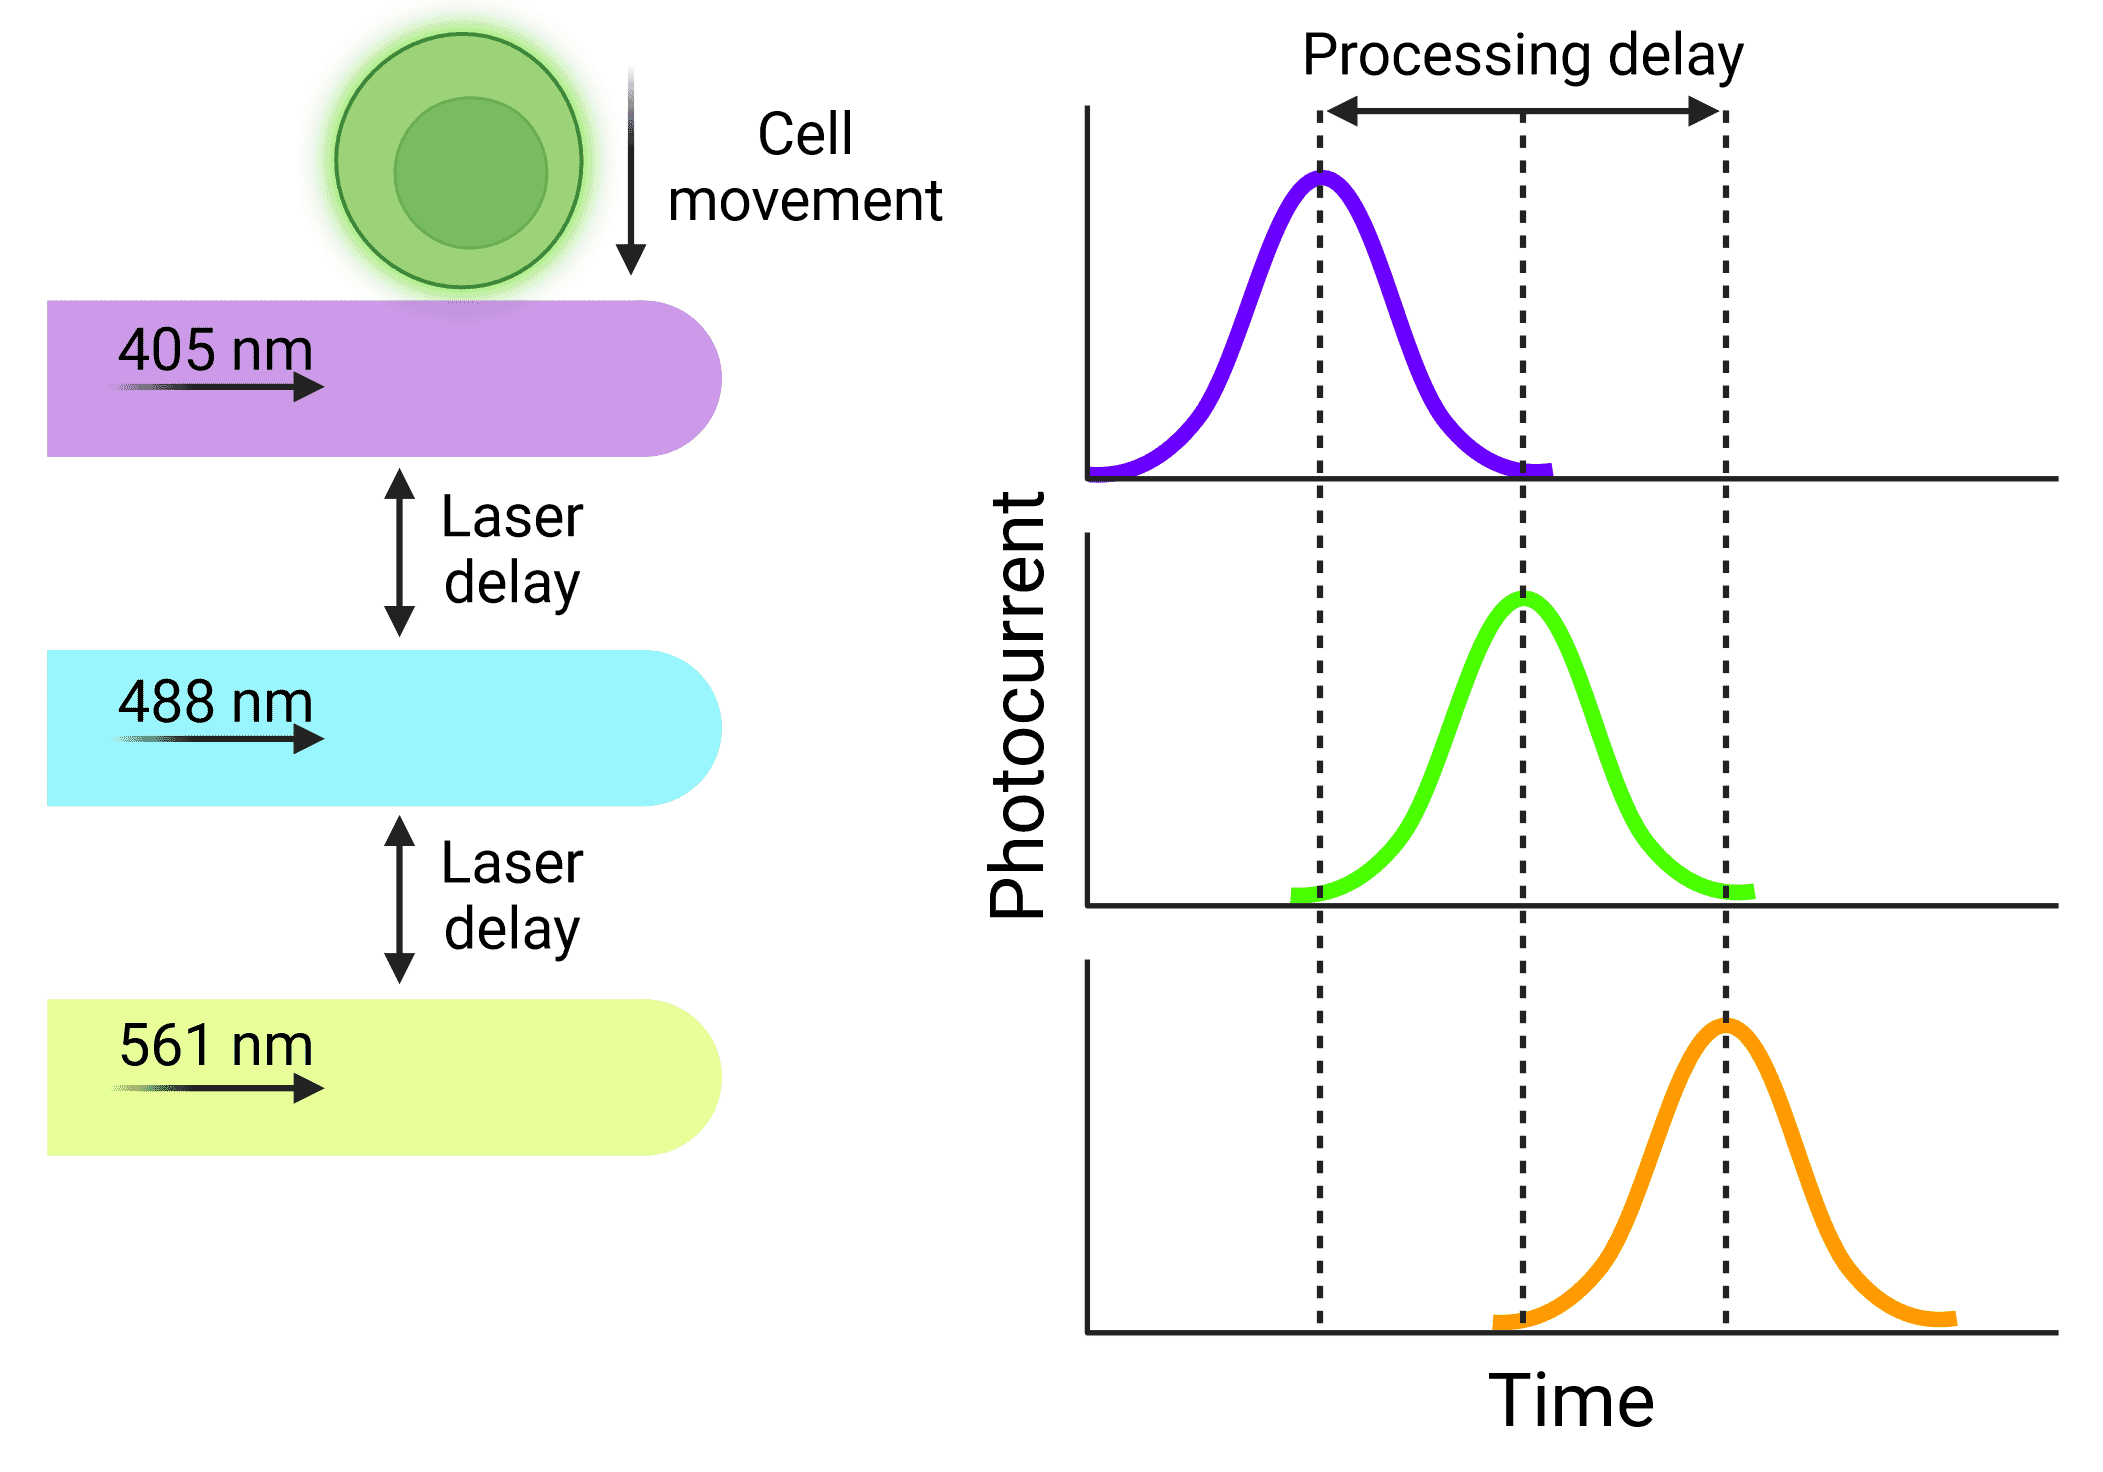
A consistent velocity of cells is especially important when using cytometers that use multiple lasers. Cells will be interrogated by the lasers sequentially, but researchers need to ensure that the signal from each laser is correctly assigned to the same cell. The distance between the lasers is fixed, so the electronics that process the signals resulting from each laser can be calibrated to activate at fixed times, based on how quickly the cell will move through the interrogation points (Figure 3). Fluidics that do not provide reliable velocities can cause significant disruptions to data, or a complete loss of signal from some lasers.
Figure 3: Delays in signal processing Particles will be interrogated by lasers sequentially, resulting in signals that are offset from each other. Knowing the length of that delay and keeping it stable means that signals will not be missed or excluded and can be accurately assigned to the correct cell.
Debris and air bubbles can disrupt the fluidics system and introduce instability, and so must always be carefully removed if present. Other factors that disrupt fluidic stability relate to sample preparation, including clumps of cells (e.g. due to cell death), insufficiently dispersed cells (e.g. from tissue), hard components of samples (e.g. bones, extracellular matrix).
Optics
The optics of a flow cytometer include the lasers for interrogating cells, and the filters and mirrors that restrict signals and direct it to the appropriate detectors. A key aspect of optics in any system, including cytometers, is that everything must be perfectly aligned so that light flow is uninterrupted and reaches detectors with maximum fidelity. Cells leaving the flow chamber must also be in alignment for consistent illumination, so cytometers are often set up on an optical bench to provide a stable surface for correct alignment of the optics with the sample.
Lasers
Lasers are used in flow cytometers because they provide a precise, single wavelength of light of a known power level for any color from ultraviolet to far red. The most common lasers used in traditional flow cytometers are 355 nm (ultraviolet), 405 nm (violet), 488 nm (blue), 532nm (green), 552nm (green), 561 nm (green-yellow), and 640 nm (red).11 These can excite a wide range of fluorophores. It is common for flow cytometers to have up to 4 or 5 lasers, though more are possible to allow interrogation of 30-50 parameters.
Mirrors and Filters
Signals are targeted to the detectors with beamsplitters or dichroic mirrors, which transmit some wavelengths while reflecting others. This allows light above or below a certain wavelength to reach a detector, while the rest goes to another detector or another mirror.
Filters are placed in front of the detectors so they detect and process signal from a narrow range of desired wavelengths, from specific fluorophores.
Different types of filters include shortpass (SP), longpass (LP) and bandpass (BP) filters (Figure 4). Shortpass filters allow light through that is equal to or shorter than their specified wavelength, while longpass filters transmit light equal to or longer than their specified wavelength. Bandpass filters transmit light in between two wavelength boundaries. For example, a 585/42 bandpass filter transmits light at 585 ± 21 nm, resulting in a 42 nm wide band with 585 nm at the center (564-606 nm). Cytometers also use neutral density filters, which reflect or absorb a portion of all wavelengths of light. This reduces the intensity of the light that reaches detectors, which can be helpful when using particularly bright fluorophores.
Figure 4: Different types of light filter used in flow cytometry and their associated transmission curves.
Electronics
Detectors used in flow cytometry include silicon photodiodes, photomultiplier tubes (PMTs), and avalanche photodiodes (APDs). Each detector will correspond to a different parameter, such as the fluorescence signal for a specific target cell surface protein. PMTs and APDs are extremely sensitive and can be used to measure weak fluorescence signals, while silicon photodiodes are the least sensitive and are used for forward scatter. Forward scatter tends to be the strongest signal when measuring cells, although this is not the case for smaller particles such as bacteria or exosomes.
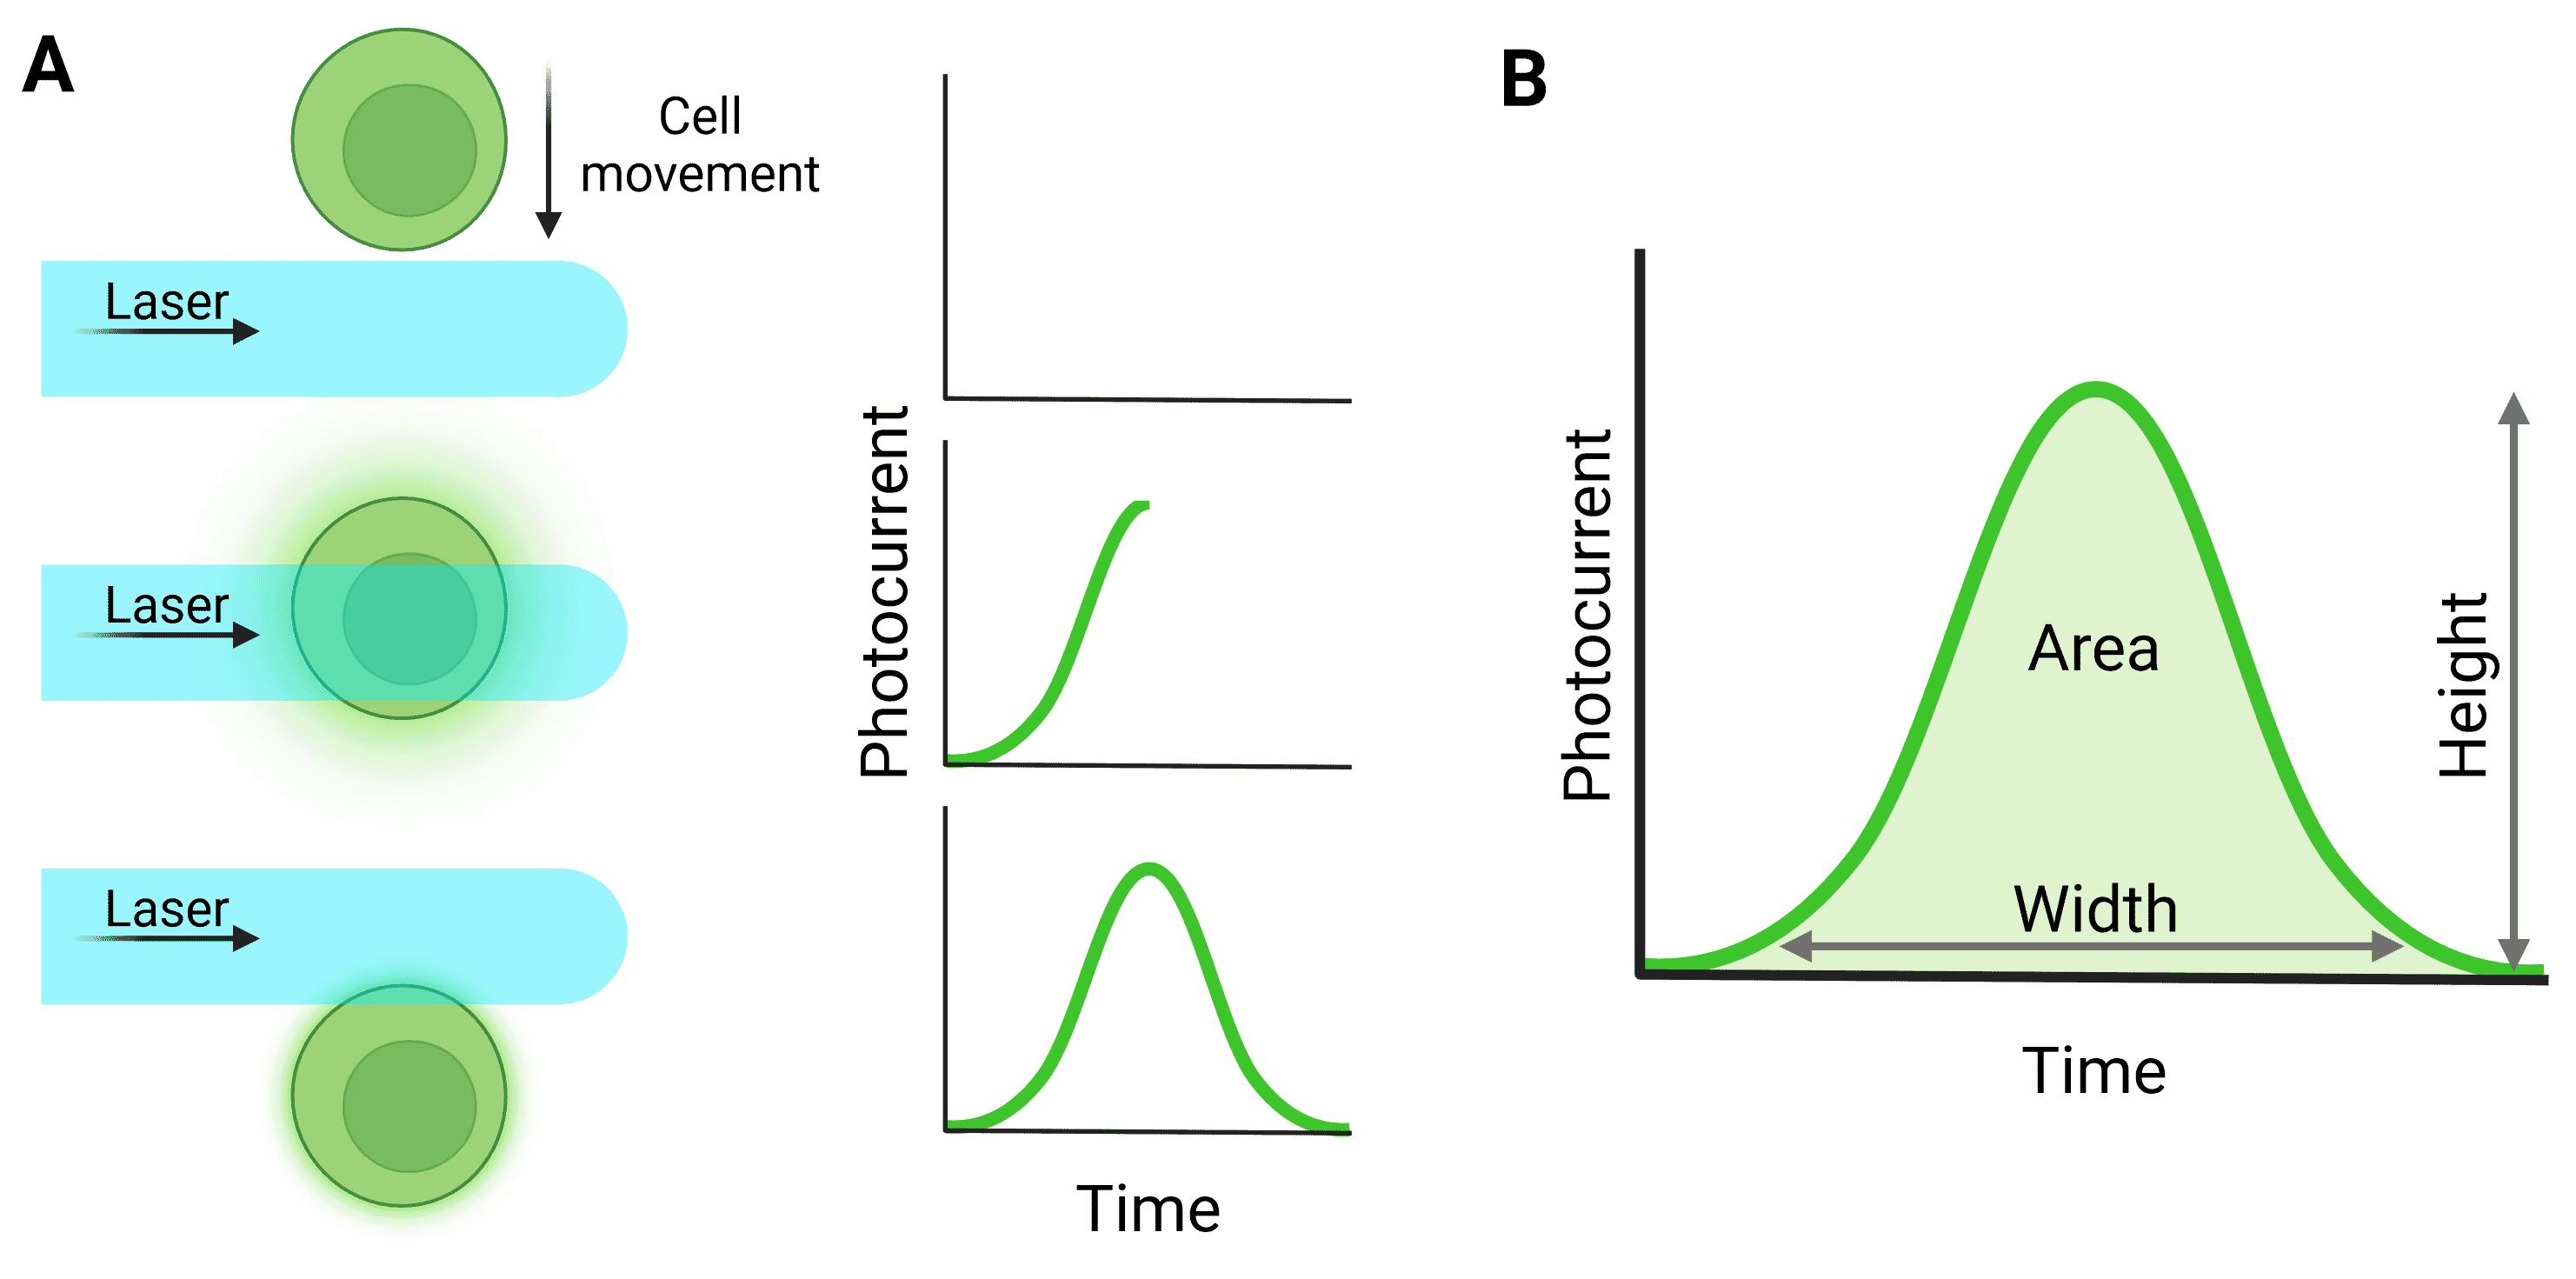
Light signals are converted to electronic signals (voltages) by the detectors when photons hit the detector surface. The voltage pulse starts when the particle first moves in front of the laser and starts to scatter light or fluoresce, reaching a peak when the particle is in the center of the beam (Figure 5). The pulse returns to baseline as the particle leaves the beam.
Figure 5: Pulse generation from particle detection. A, The cell moves through the laser beam to generate a pulse. B, Quantification of the full pulse. Height refers to the maximum value generated by the particle; Width relates to the total time the particle was illuminated by the laser; Area relates to the integral of the pulse. ‘Signal intensity’ can refer to height or area. Note that for a pulse to be processed in this way, detection in the trigger channel must have surpassed the threshold level.
Signal Processing and Thresholds
Detected signals need to be processed for analysis. The height and area of the voltage pulse correspond to the signal intensity, proportional to the number of photons that was detected. The width of the pulse relates to the illumination time, and so can highlight the presence of doublets.
However, not all pulses correspond to real signals of interest. The decision of whether to process and register a signal is determined by whether the signal in one channel, the ‘trigger’ channel, passes a pre-defined threshold. The trigger channel is usually forward scatter. Any signals for a particle that has failed to reach the trigger channel threshold are ignored by the detectors. A successfully detected pulse is referred to as an ‘event’.
When multiple lasers are used for many parameters, the data must be aligned so that all signals relating to a single particle are assigned to that same particle (Figure 3).
Data is displayed on either a logarithmic or linear scale, usually depending on the magnitude of differences observed between particles in the sample. Logarithmic scaling is particularly useful because it expands differences between weak events. The measurements of multiple parameters can be plotted against each other to identify and compare populations (see Flow Cytometry Data Analysis).
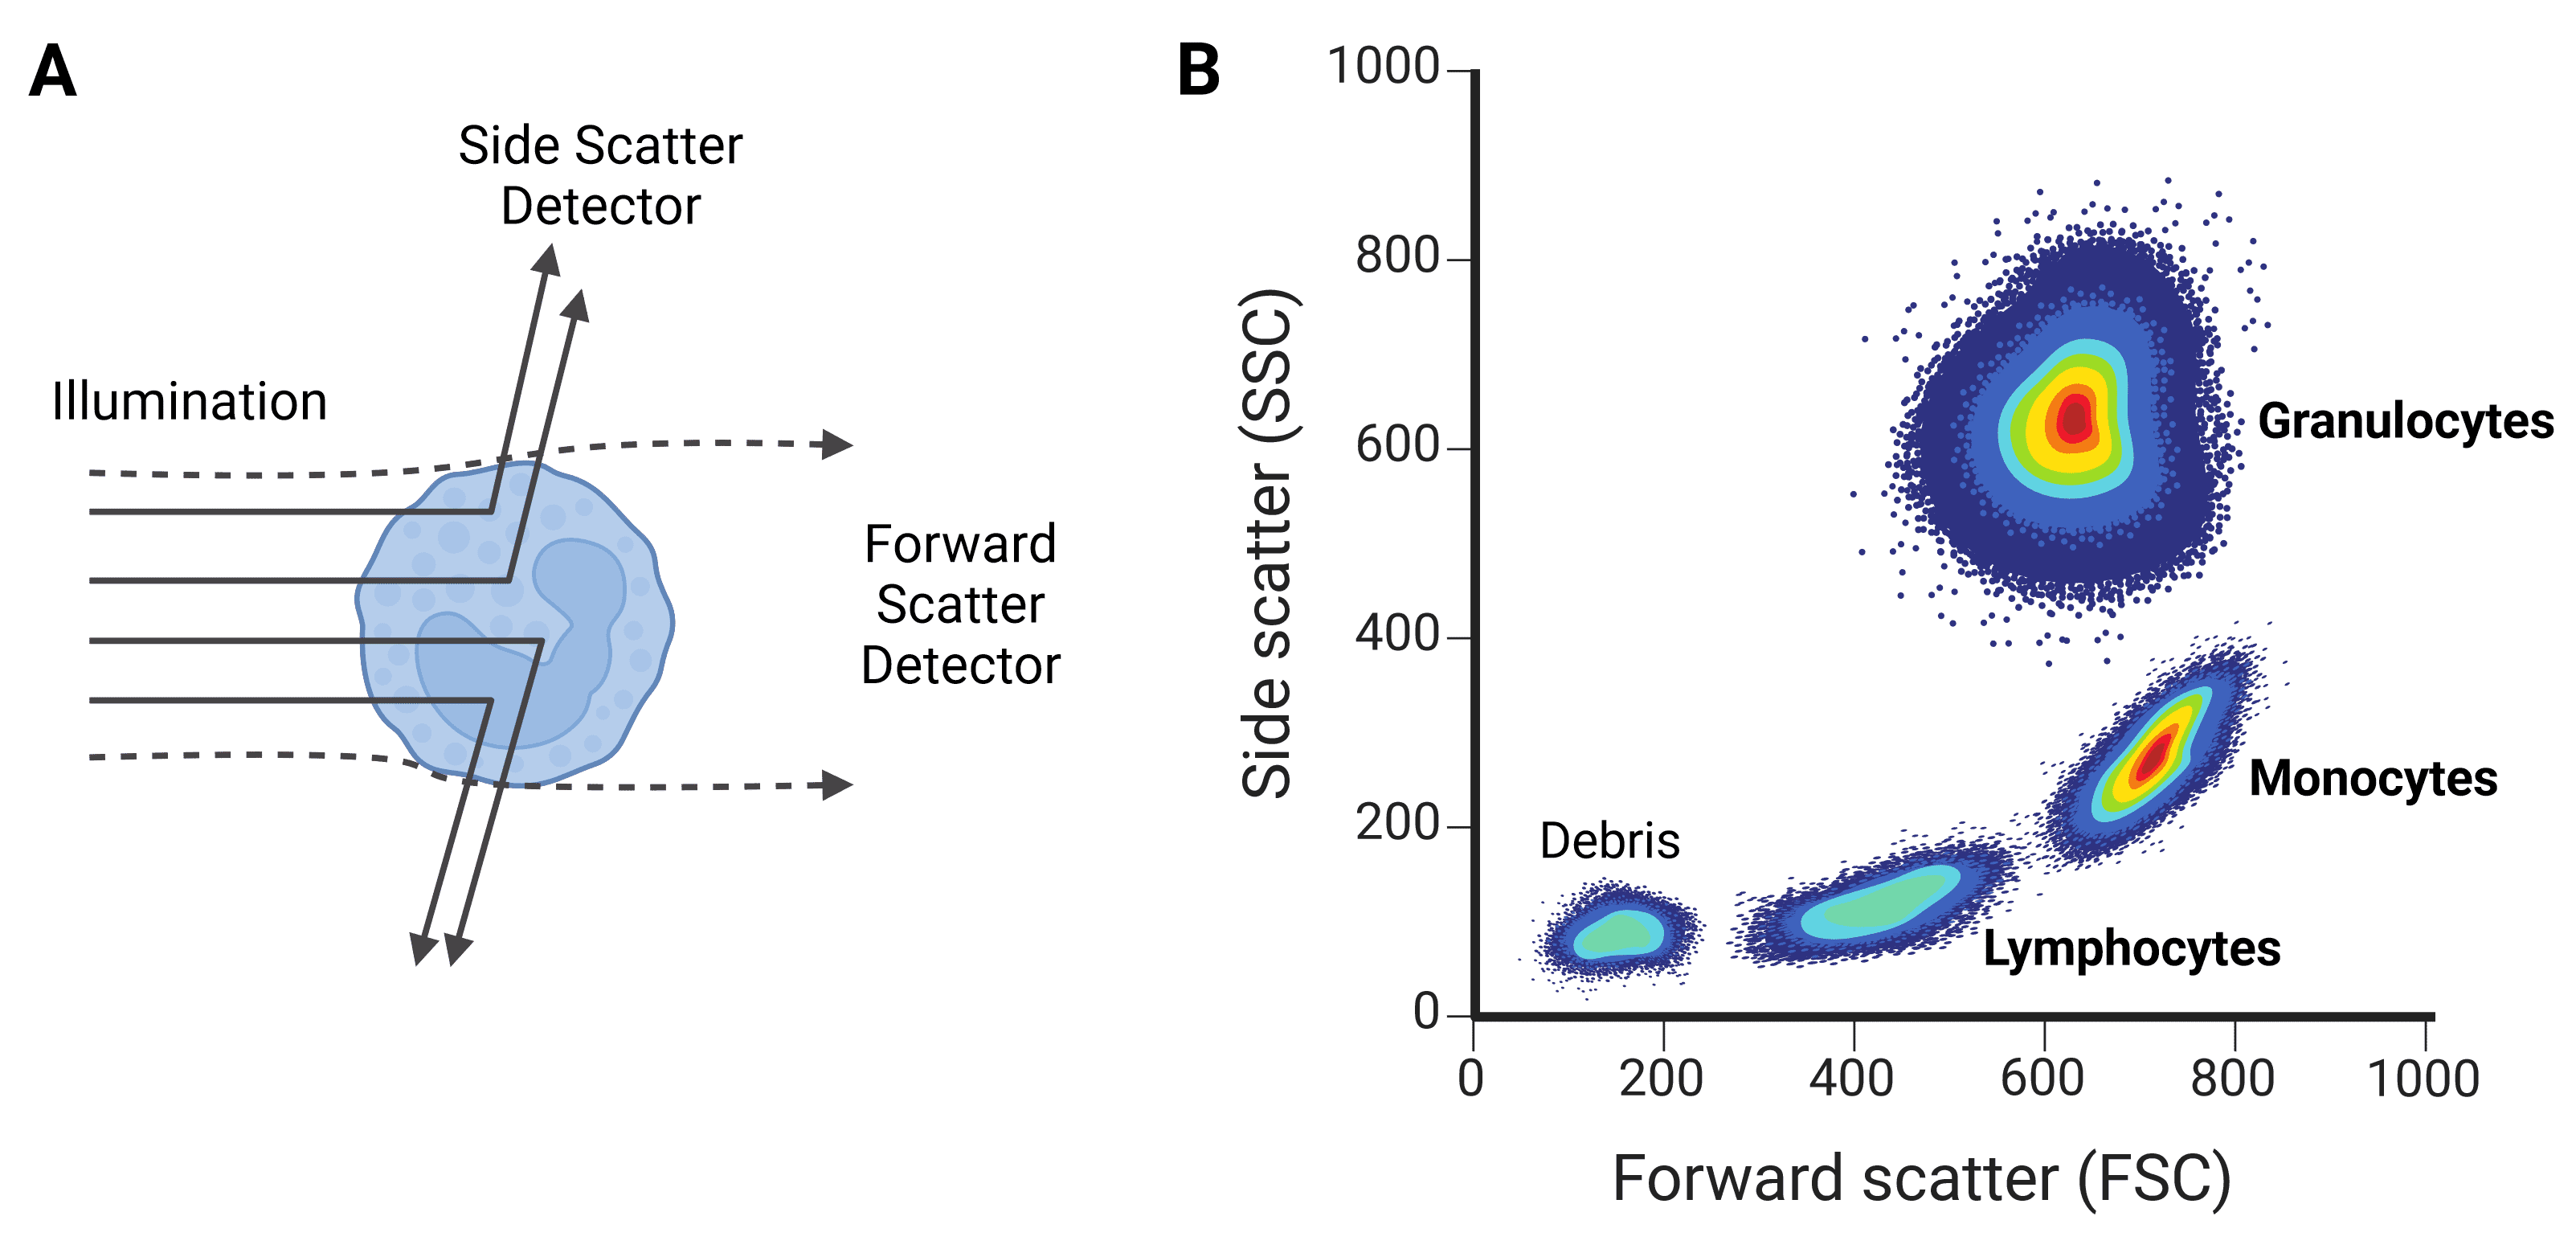
Light is scattered or deflected in all directions by the cell as soon as the laser hits it. This scatter is useful and tells researchers about the size and contents of the cell (Figure 6).
Figure 6: Forward scatter (FSC) and side scatter (SSC). A, FSC gives information about a cell’s size, while SSC provides information on the cell’s granularity. B, FSC and SSC can be used to characterize different cell types, such as the leukocyte populations shown here.
Forward scatter (FSC) refers mostly to light that diffracts around the particle, and is collected just offset (up to 20°) from the axis of the laser beam. FSC is approximately proportional to cell volume or size: larger cells diffract more light than smaller cells. FSC is not useful for particles smaller than the wavelength of the laser, such as 200 nm exosomes, because they will not diffract the light and so will be indistinguishable from background.
Side scatter (SSC) refers to light that is reflected or refracted by the contents of the cell, which alter the refractive index. SSC therefore corresponds to cell granularity (often referring to secretory vesicles in immune cells) or internal complexity. SSC is collected at approximately 90° to the laser’s axis.
Correlated values of FSC and SSC can be quite typical of certain cell types, and so can be used to coarsely distinguish cell types within a heterogeneous sample such as blood. For example, leukocyte subpopulations can be differentiated by size and granularity (Figure 6).
Other factors beyond size and internal complexity can contribute to FSC and SSC, however, including the nature of the sample, the wavelength of the laser, and the refractive index of the sample and sheath fluid. Fluorescence is considerably more reliable than scatter for defining cell types, enabling researchers to differentiate ever more specific subpopulations.
One of the strongest aspects of flow cytometry is the technique’s ability to generate rich and highly detailed data from single cells. This relies on fluorescence. Beyond forward and side scatter, fluorescent molecules, with different excitation and emission characteristics allow researchers to detect and differentiate many parameters from a single cell, including cell surface and internal protein expression, activation state, and proliferation state.
Fluorescent detection provides high sensitivity by enabling detection even of lowly expressed antigens compared to background signal. Fluorescence is also highly specific when coupled with antibodies, so that any protein can be targeted and used to identify subpopulations of cells within a complex sample.
Fluorescence refers to the light that is emitted when a fluorescent compound, also known as a fluorophore or fluorochrome, absorbs light of a specific wavelength (excitation), causing it to emit light of a longer wavelength (emission). The incoming light excites electrons in the fluorescent molecule to a higher energy state. The electrons rapidly revert to their ground state, releasing the excess energy as a photon of light.
The Visible Spectrum
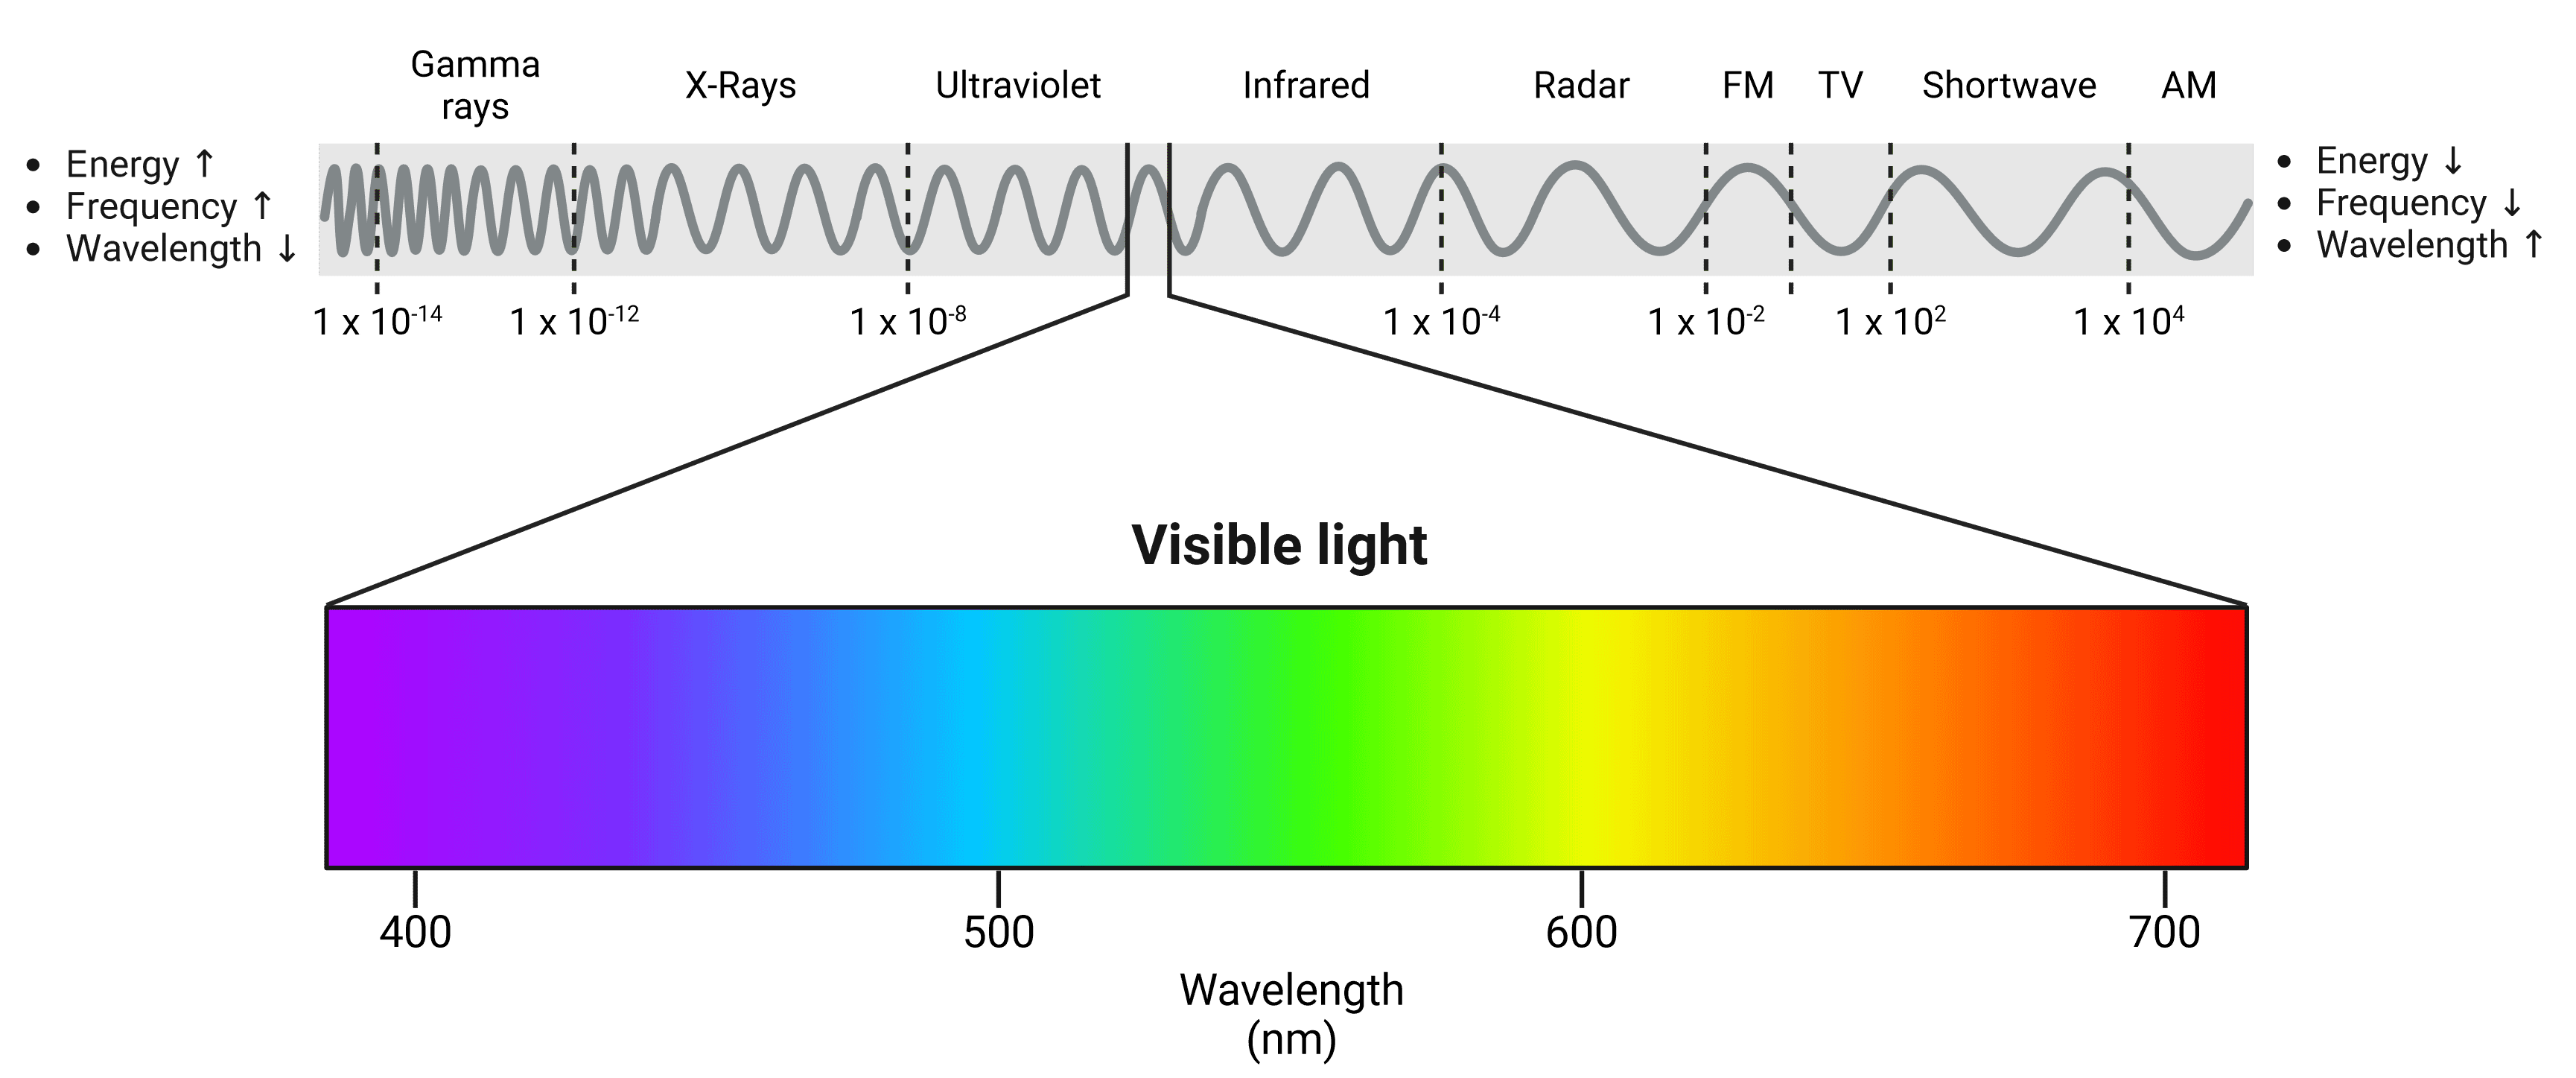
Light is a form of electromagnetic radiation and travels in waves. These waves have a specific wavelength based on how much energy they contain, which in turn will determine what color we perceive them as. The human eye is able to see light waves between approximately 380 nm and 700 nm, between which can be seen the colors of the rainbow (Figure 7). Shorter, high energy wavelengths are close to the ultraviolet end of the spectrum, while longer, low energy wavelengths are closer to infrared.
Figure 7: The electromagnetic spectrum. The visible light spectrum has been expanded. Violet wavelengths have higher energy while red wavelengths have lower energy. Wavelengths of other waves are shown in meters.
Excitation and Emission
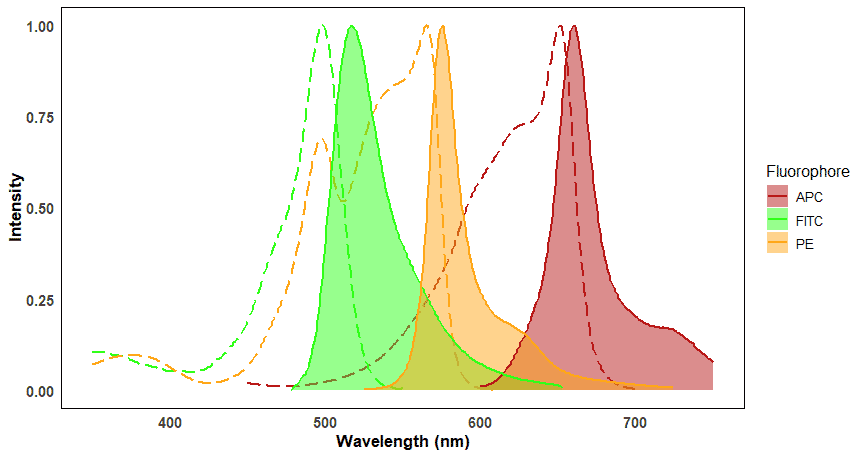
Each fluorophore is excited by specific wavelengths of light and each fluorophore will emit light at specific wavelengths. These wavelength ranges are referred to as a fluorophore’s excitation and emission spectra. Spectrum viewers are useful tools for visualizing the excitation and emission spectra for a large number of fluorophores, and can help determine spectral overlap (Figure 8). Overlap will be discussed more under Fluorescence Compensation.
Figure 8: Excitation and emission spectra of three commonly used fluorophores in flow cytometry. Excitation spectra are shown as dashed lines, corresponding to the emission spectra (filled plots) of the same color. The distance between the peaks of excitation and emission spectra for a given fluorophore is called the Stokes shift. Note that some fluorophores, such as FITC and PE, can be excited by the same wavelength (e.g. ~495 nm) but emit at distinct wavelengths.
The peak of the excitation spectrum indicates the precise wavelength at which fluorophores absorb the most photons, which in turn results in the brightest emission. This makes signals easiest to detect, so the position of the excitation peak will generally dictate which wavelength laser to use. An example of this is FITC, which has an excitation peak of ~495 nm. The best conventional laser to use to excite FITC is therefore the 488 nm laser for near-maximal excitation.
Emitted light always contains less energy than the excitation light. The lower energy emitted light therefore has a longer wavelength and therefore will be a different color, closer to the red end of the spectrum. The difference between the peaks of the excitation and emission spectra is called the Stokes shift.
Autofluorescence
Cells can emit fluorescent signal even in the absence of any specific fluorophore. This is called autofluorescence. Autofluorescence is an issue because it reduces the signal to noise ratio, particularly within the violet to green end of the spectrum, potentially masking dim experimental fluorescence.
The extent of autofluorescence a cell emits depends on the cell type, with larger cells, cells containing more granules, and dead cells tending to produce more autofluorescence. The activation state and sample preparation process can also influence the amount of autofluorescence produced. Nonetheless, autofluorescence is usually due to certain cellular components. Collagen, elastin, cyclic ring compounds including NADPH and riboflavin, aromatic amino acids, and some organelles such as mitochondria and lysosomes all tend to emit some autofluorescence, particularly when excited by a 488 nm laser.
To reduce autofluorescence, a longer wavelength laser can be used if one is accessible and compatible with available fluorophores. If not, unstained controls can help to determine autofluorescence levels, which can then be gated out to reveal true positive signals.
Fluorophores for Flow Cytometry
There are hundreds of fluorophores that are suitable for flow cytometry, which can be classified according to their molecular structure or their application. Table 1 lists some of the types of fluorophores used in flow cytometry along with their advantages and disadvantages,11 while Table 2 shows some common fluorophores and their excitation and emission maxima. Note that in addition to fluorophores, antibodies used in flow cytometry can also be conjugated to heavy metals. These are used only with mass cytometry.
| Fluorophore Class | Examples | Advantages | Disadvantages |
|---|---|---|---|
| Organic Dyes | Alexa Fluor dyes, e.g. Alexa Fluor 488 Cy dyes, e.g. Cy3 FITC Pacific Blue Texas Red | Stable Easy to conjugate to antibodies Widely available Modern dyes are more resistant to photobleaching | Small Stokes shifts Not as bright as some other classes |
| Fluorescent Proteins | GFP CFP YFP mCherry tdTomato | Wide range of colors available Can be used as expression reporters No antibodies required | Requires genetic modification to be expressed |
| Phycobiliproteins | Phycoerythrin (PE) Allophycocyanin (APC) Peridinin chlorophyll protein (PerCP) | Bright Large Stokes shifts Very stable Large size makes them useful for quantitative flow cytometry | Susceptible to photobleaching |
| Nanocrystals | Qdot 605 Qdot 655 Qdot 705 Qdot 800 | Bright Large Stokes shifts Tight emission spectra reduces opportunity for spectral overlap Excited by UV-violet lasers but emit in a wide range of colors, so useful if few lasers available | Difficult to conjugate to antibodies Some excitation seen across multiple laser lines, complicating compensation |
| Polymer Dyes | Brilliant Ultraviolet Brilliant Violet Brilliant Blue Super Bright 436 | Very photostable Avoid the issue of excitation by multiple lasers that Qdots have Single laser excitation for multiple fluorophores | |
| Tandem Dyes | PE-Alexa Fluor 700 APC-Cy5.5 APC-Cy7 | Long stokes shifts Makes more colors available for the same number of lasers | Instability Photosensitive Lot-to-lot variability Donor fluorescence can leak through |
| Nucleic Acid Dyes | DAPI Hoescht 33342 Propidium iodide (PI) | Widely used Easy to use No antibodies needed Multiple applications, e.g. cell cycle analysis, viability | Some cannot distinguish between living and dead cells Broad emission spectra |
| Proliferation Dyes | Carboxyfluorescein succinimidyl ester (CFSE) | Suitable for long term studies of proliferation compared to BrdU | Can be toxic to cells at high concentrations |
| Calcium Indicators | Indo-1 Fluo-3 | Give a live readout of cellular activity Can be used in conjunction with other dyes to mark cell types | Ratiometric fluorescence can complicate analysis Can have high background signal |
Table 1: Types of fluorophore used in flow cytometry
| Fluorophore | Type of Fluorophore | Maximum Excitation (nm) | Maximal Emission (nm) | Relative Brightness |
|---|---|---|---|---|
| DyLight 405 | Organic dye | 400 | 420 | 3 |
| Alexa Fluor 405 | Organic dye | 401 | 421 | 3 |
| EBFP | Fluorescent Protein | 383 | 445 | 2 |
| Pacific Blue | Organic dye | 410 | 455 | 1 |
| CFP | Fluorescent Protein | 439 | 476 | 2 |
| EGFP | Fluorescent Protein | 484 | 509 | 4 |
| Alexa Fluor 488 | Organic dye | 495 | 519 | 3 |
| FITC | Organic dye | 490 | 525 | 3 |
| YFP | Fluorescent Protein | 514 | 527 | 5 |
| DyLight 550 | Organic dye | 562 | 576 | 4 |
| PE | Phycobiliprotein | 490; 565 | 578 | 5 |
| RFP | Fluorescent Protein | 558 | 583 | 4 |
| Qdot 605 | Nanocrystal | 300 | 605 | 5 |
| mCherry | Fluorescent Protein | 587 | 610 | 3 |
| Qdot 655 | Nanocrystal | 300 | 655 | 5 |
| APC | Phycobiliprotein | 650 | 661 | 4 |
| Alexa Fluor 647 | Organic dye | 650 | 665 | 4 |
| PE-Alexa Fluor 647 | Tandem | 496, 546 | 667 | 4 |
| PE-Cy5 | Tandem | 496, 546 | 667 | 5 |
| Brilliant Blue 660 | Polymer Dye | 484 | 667 | 5 |
| DyLight 650 | Organic dye | 654 | 673 | 4 |
| PerCP | Phycobiliprotein | 490 | 675 | 2 |
| PerCP-Cy5.5 | Tandem | 490 | 695 | 3 |
| PE-Cy5.5 | Tandem | 496, 546 | 695 | 4 |
| Qdot 705 | Nanocrystal | 300 | 705 | 5 |
| Alexa Fluor 700 | Organic dye | 702 | 723 | 2 |
| PE-Alexa Fluor 750 | Tandem | 496, 546 | 779 | 4 |
| Super Bright 780 | Polymer Dye | 413 | 780 | 3 |
| PE-Cy7 | Tandem | 496, 546 | 785 | 2 |
| APC-Cy7 | Tandem | 650 | 785 | 2 |
| Brilliant Violet 786 | Polymer Dye | 405 | 787 | 3 |
| Brilliant Ultra Violet 805 | Polymer Dye | 350 | 805 | 3 |
Table 2: Common fluorophores used in flow cytometry, ordered by maximal emission wavelength. For relative brightness, 1 is dimmest, 5 is brightest. Relative brightness is meant as a guide only. Full excitation and emission spectra should be checked prior to use to confirm minimal overlap between fluorophores.
Tandem Dyes
Tandem dyes covalently couple one fluorophore to another (often phycobiliproteins or polymer dyes with small organic dyes).11 The aim is to create a dye that can make use of Förster resonance energy transfer (FRET) to greatly increase the Stokes shift of a fluorophore. This therefore increases the number of fluorophores that can feasibly be excited by a single laser source.
FRET is achieved when the first dye (the donor) is excited by the laser and transfers this energy to an acceptor fluorophore. The transfer of energy occurs by nonradiative dipole-dipole coupling rather than via emitted fluorescence. The acceptor molecule is raised to its excited state and will then emit fluorescence.
Tandem dyes can be used in conjunction with single fluorophores to create a panel of fluorophores that can be activated by a single laser. For example, Alexa Fluor 488, PE, PerCP-Cy5 5 and PE-Texas Red can all be excited by a 488 nm laser, but will generate fluorescence in the green, yellow, red and infrared ranges.
The disadvantages of tandem dyes include them being unstable and photosensitive, requiring careful handling and protection from light. FRET efficiency is never 100%, meaning that some bleed-through fluorescence emission from the donor fluorophore can occur. They also suffer from significant batch-to-batch variation, meaning each new lot requires optimization.
Designing a Multicolor Flow Panel
Before designing a flow panel, the combination of antibodies and fluorophores used in a flow cytometry experiment, it is important to establish which colors your specific flow cytometer is capable of stimulating and detecting. The lasers, filters, and detectors all contribute to which combinations of fluorophores will be compatible with a cytometer. For example, there is no point in using an antibody conjugated to Alexa Fluor 647 if only a 488 nm laser is available, because Alexa Fluor 647 is not excited at that wavelength.
Once the cytometer’s specifications have been confirmed, the fluorophores must be chosen. The choice of fluorophore will be primarily determined by the following criteria:
While a good starting point may be a published panel, there can be significant variability between cytometers, so reproducing a published panel will still require optimization.12
A final question is to ask how many markers are truly required to achieve the experimental aims. More markers generally results in more colors, more controls and greater complexity.
Stain Index
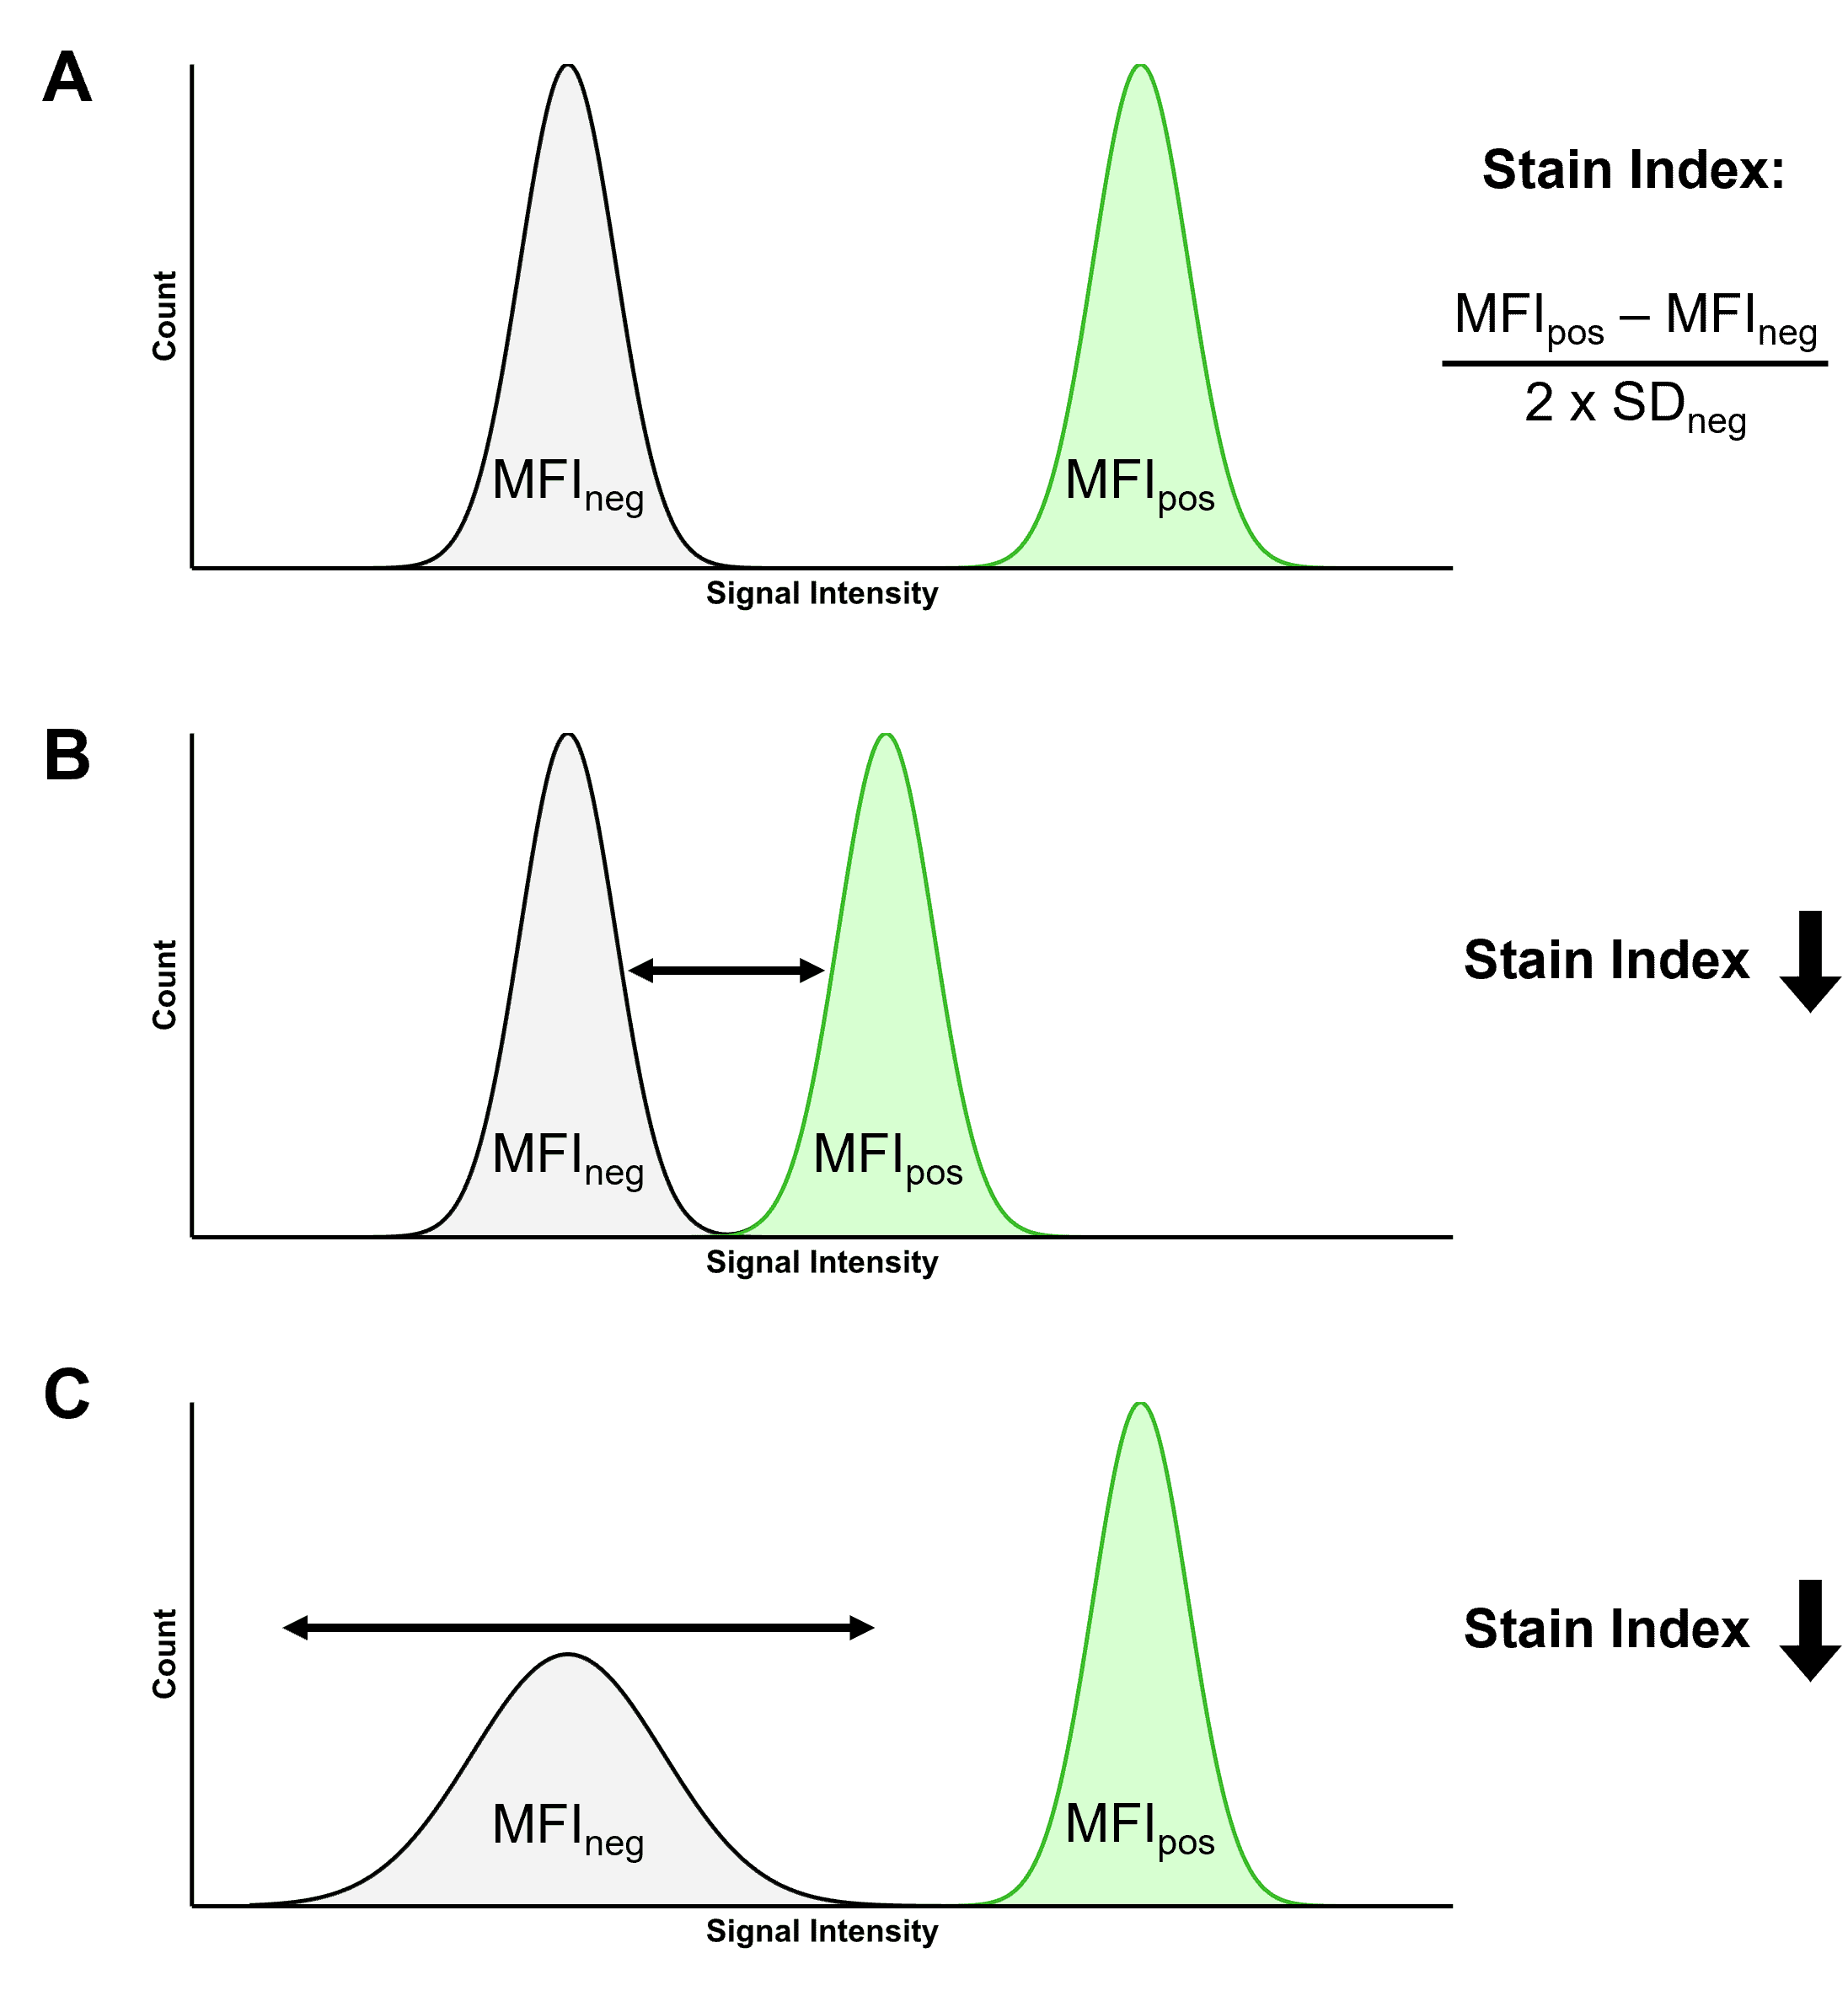
The Stain Index (SI) is a way of normalizing brightness so that fluorophores can be compared to each other. The ability of a fluorophore to resolve positive populations from negative populations is determined by a number of factors, including:
The SI takes these factors into account, and is a ratio calculated using the median fluorescence intensity (MFI) of the positive and negative populations, and the standard deviation (SD) of the negative population using the formula in Figure 9. The figure also illustrates how the SI is influenced by changes to these parameters, such as a dimmer fluorophore or a more dispersed negative population.
Figure 9: Illustrating the Stain Index (SI). A, Two populations of cells, one negative and one positive for a given fluorophore. The SI of that fluorophore can be calculated using the median fluorescence intensity (MFI) of the positive and negative populations, and the standard deviation (SD) of the negative population. B, If the difference between the positive and negative populations decreases, so does the SI. C, The SI decreases if the SD increases, reducing the ability to resolve the two populations.
It is important not to dismiss dim fluorophores out of hand. Even dim fluorophores can be useful (or may have to be used!) with the right antibody.
Fluorescence Compensation
Spectral overlap occurs when the light emitted from one fluorophore emits into a detector that is being used to measure fluorescence from another fluorophore. This spillover creates a false positive signal, implying that a cell or particle is positive for both fluorophores and antigens. The best way to avoid spectral overlap is to simply use fluorophores that are far apart from each other on the spectrum, but this is not always possible, particularly when using several markers. Instead, compensation is used by cytometers to calculate what proportion of signal in a channel is the result of spillover and to electronically remove false positive signal (Figure 10).
Figure 10: Fluorescence compensation in flow cytometry. A, Emission spectra of FITC and PE demonstrates significant overlap or “spillover”. B, Compensation essentially removes the spillover to get rid of false positive signals. C, A flow cytometry plot of a single-color FITC control illustrating the consequence of spillover in an uncompensated sample. High FITC signal also results in false PE signal, resulting in a smeared plot. D, Correct compensation removes the false positive signal, resulting in populations that have the same signal in the spillover (PE) channel, indicated by the dashed black line.
Such false positives reveal themselves as a characteristic diagonal smear on two-parameter plots (Figure 10), because brighter signals result in stronger spillover. The purpose of compensation is essentially to change the values so that the median signal detected in the spillover channel for the positive population matches the median signal for the negative population, so that no false positives remain.
To determine what the correct level of signal in each channel “should” be, compensation controls are needed. These are samples that have been stained for only a single color, with one control for every color included in the experiment. Each control should contain both a positive and a negative population. The control cells that are stained for each color should match the experimental samples as closely as possible: the same cell types, expressing the same target antigens at a similar level, and of course exactly the same fluorophore must be used. If the same cells are not available, compensation beads can be used instead, which can also be useful if the target antigen is expressed at very low levels.
While compensation is one of the main reasons so many fluorophores can be used in flow cytometry compared to other techniques, compensation can only do so much. Fluorophores with a large amount of spectral overlap should be avoided, and compensation can also struggle when an extremely bright fluorophore spills into a channel being used to detect a dim population.
Careful sample preparation is essential to maintaining cell viability and generating high quality data. Even if enough target cells are present in a sample, poor sample preparation can also contribute to fluidic instability, including cell clumps and DNA aggregates.
Cell Suspensions
For flow cytometry to work, cells must be in a suspension. For some samples, such as blood, the sample is already in this format. Others must be prepared from a tissue or adherent culture, requiring the use of enzymes and mechanical force to break cells and extracellular matrix apart.
It is recommended that a gentle method of creating a single cell suspension is used, ideally as quickly as possible on ice. Trypsin alone can be harsh and can destroy cells or epitopes, so extra enzymes such as collagenase should be trialed during optimization. Vortexing and excessive centrifugation or mechanical manipulation can also affect cell viability. Any unwanted material, including clumps of cells or regions of tissue, should be dissected away or filtered away.
While blood is already a suspension, it does need an appropriate anti-coagulant. EDTA is sometimes used, but it chelates Ca2+, which can affect detection of some cytokines and cell surface markers. If red blood cells are not of interest, they can be removed using either hypotonic lysis or a density gradient with centrifugation.
Cell Number
There is no simple way for determining exactly how many cells an experiment will need to obtain statistically significant results.
If rare populations are being targeted, more cells will likely be needed. A population that represents 10% of 1,000,000 cells in a sample will yield 100,000 cells, which may be sufficient for downstream analyses compared to a population that is only 0.1% of the total cells.
Adding extra markers usually means more cells are needed, as they will continue to separate the total cell number into smaller and smaller subsets, as well as adding extra controls. At least some cells should also be kept unstained for initially setting up the cytometer at the start of an experiment.
Ultimately, determining whether a detected population represents a real biological population with a distinct function or cellular response is not a question that can be answered based on numbers or even relative frequency. See Roederer, 2008 for more detail.13
Fixation and Permeabilization for Intracellular Antigens
Staining intracellular antigens such as cytokines first requires that the cell be fixed and the membrane be permeabilized so that antibodies can reach the target. Fixation is important to stabilize cell morphology; without fixation, the cells will simply lyse during permeabilization.
Formaldehyde and glutaraldehyde are common fixatives to use, creating methylene (CH2) cross-links between proteins. Aldehyde fixatives are usually used at a concentration of 1-4% and fixation time should be limited to 1-2 hours. Alcohol-based fixatives such as methanol can also be used, usually at a concentration of 70-90% and at -20°C, though they can mask epitopes more than other fixatives.
Some fixatives, such as alcohol-based fixatives, also permeabilize the cell membrane, but this is not the case with formaldehyde, so permeabilization is usually performed with detergents. Triton, digitonin and saponin all permeabilize the cell membrane, albeit to different extents (e.g. saponin and digitonin do not break the nuclear envelope).
Blocking
Fc receptors are present on the surface of monocytes, macrophages, dendritic cells and B cells. These receptors bind to the Fc region of antibodies, regardless of the Fab region or the target antigen. If these cells are present in a sample, this can therefore result in non-specific signal and false positive events. Fc blocking agents can be used to prevent this interaction from occurring, and should be included when working with homogenized tissue samples and certain cell lines.
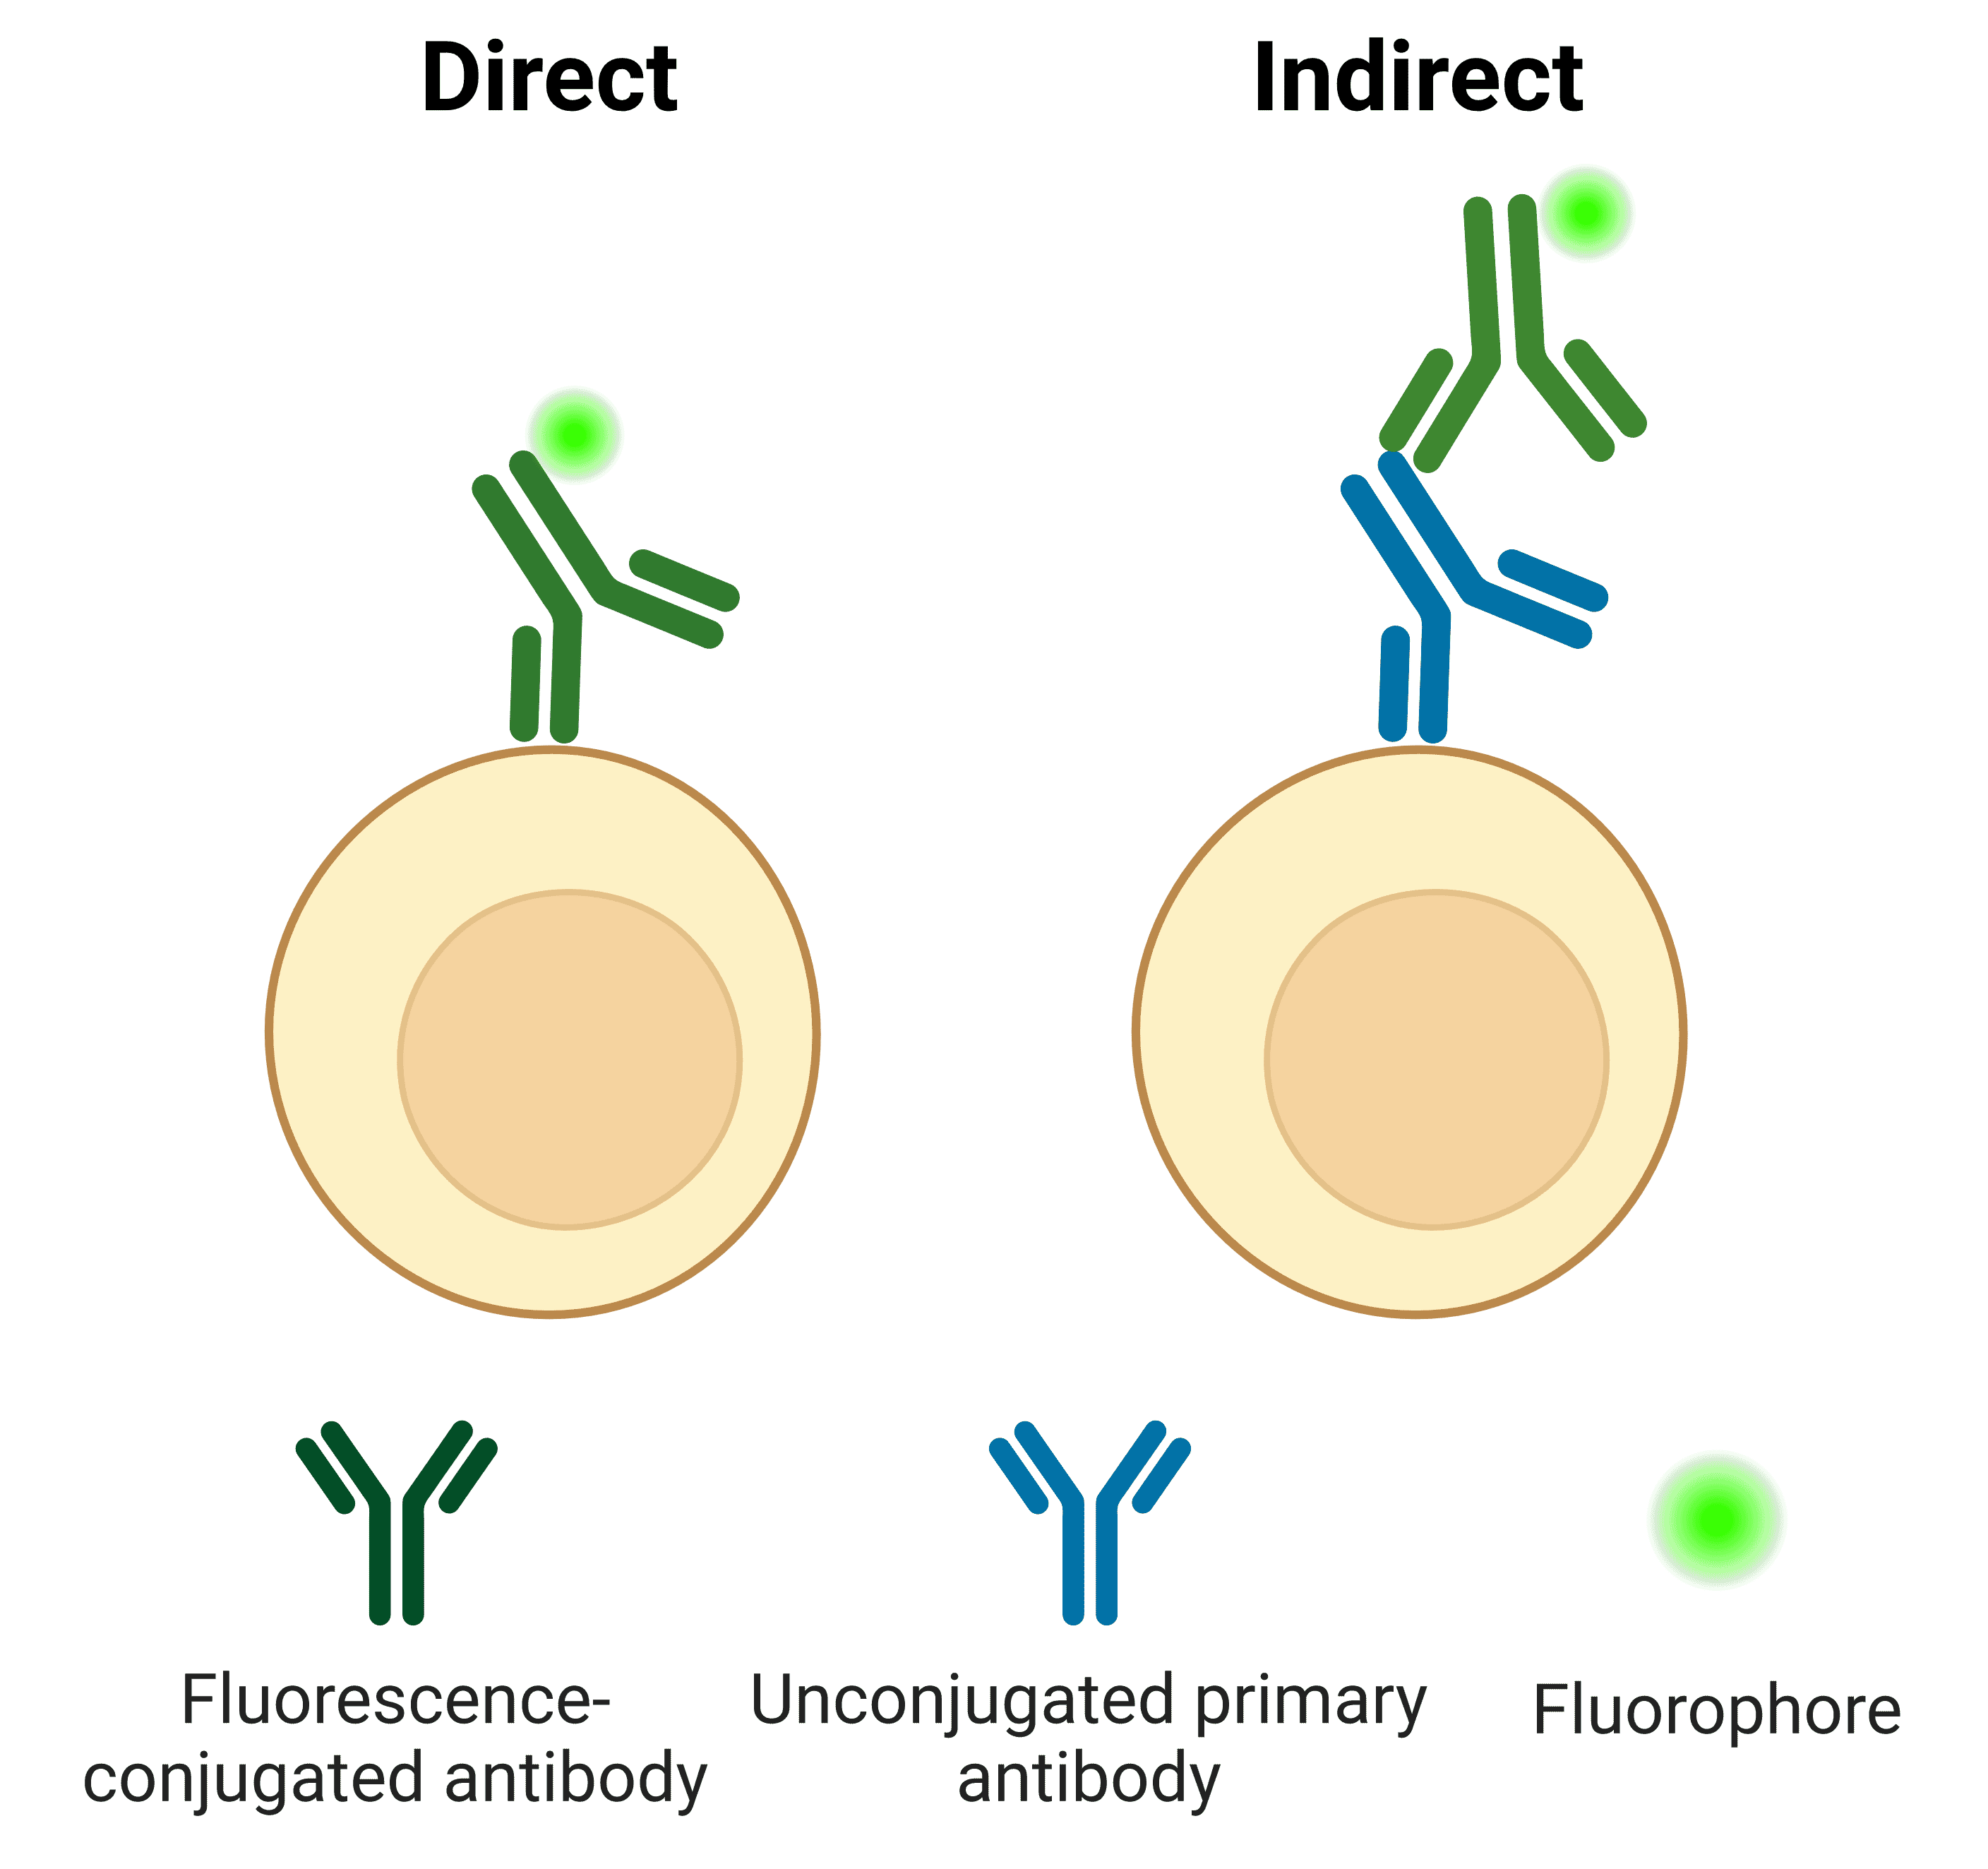
While genetically encoded fluorescent proteins can be used to mark cell populations in flow cytometry, conjugated antibodies provide far more flexibility. Labeling antibodies with fluorophores, either directly or indirectly, is the most common and versatile option.
Direct vs Indirect Antibody Labeling
Primary antibodies can be directly conjugated to a fluorophore (Figure 11). The direct approach is often preferred in flow cytometry for its ease of use and speed, which is particularly important when working with live cells.
Indirect labeling refers to when the primary antibody is detected by a secondary antibody, which is conjugated to a fluorophore. The secondary antibody usually targets the host species of the primary antibody. For example, a primary antibody raised in rabbit will be detected by an “anti-rabbit” secondary antibody.
Figure 11: Direct and indirect detection of antigens in flow cytometry.
Table 3 below illustrates some of the advantages and disadvantages of using direct or indirect labeling strategies.
| Direct | Indirect | |
|---|---|---|
| Time | Quicker, as there is only one labeling step | Longer due to secondary incubation |
| Cost | Conjugated primary antibodies are more expensive than unlabeled primaries | Secondary antibodies are relatively cheap, and can be used with many primary antibodies across experiments |
| Complexity | More antigens can be targeted because you do not need to rely on species recognition by a secondary antibody, so working with many fluorophores increases complexity | Additional controls are required for indirect detection, but fewer antigens can be targeted |
| Flexibility | Commercially available primary antibody conjugates will be limited, but many antigens can be targeted simultaneously | Secondary antibodies allow any primary antibody to be paired with any fluorophore easily, but the number of antigens that can be detected is limited by the number of species that secondary antibodies are derived from (otherwise cross reactivity occurs) |
| Background | From autofluorescence, non-specific binding etc. | Extra background due to non-specific binding of secondary antibodies |
| Cross-reactivity | Minimal | Secondary antibodies may cross react with other species, but this can be prevented with pre-adsorbed secondaries |
| Amplification | None | Multiple secondary antibodies can bind to the primary, meaning more fluorophores per epitope |
Table 3: Comparison of main features of direct and indirect labeling methods in flow cytometry.
Cell Surface, Intracellular, and Secreted Antigens
Cell surface antigens are commonly used to define cell populations in flow cytometry. In part this is due to their ease of detection, but it is also because common target populations, such as immune cell subsets, have well-established cell surface markers.
Intracellular antigens can also be targeted. As discussed in Intracellular Antigen Staining above, this requires extra fixation and permeabilization steps compared to the procedure for cell surface antigens. These steps can affect the detection of antigens and the properties of some fluorophores. For instance, alcohol fixation can mask some epitopes, cell surface markers may be harder to detect after fixation, and the brightness of tandem dyes tends to be reduced after fixation or permeabilization.
Other steps may be also required depending on the nature of the intracellular target. For example secreted cytokines may require both stimulation and treatment with monensin or brefeldin A for cytokine retention in the Golgi apparatus.
If staining a combination of cell surface and intracellular antigens, cell surface markers should be stained before fixation in case fixation or permeabilization adversely affects their signal. An exception to this is when targeting phosphorylated antigens, due to the often transient nature of phosphorylation events. These usually need to be fixed immediately to preserve the phosphorylation state.
Proper use of analytical tools and gating strategies is essential to interpreting flow cytometry experiments correctly.
Guidelines exist for the reporting and presentation of flow cytometry data, covering experimental design, sample information, cytometer configuration, analysis approach and so on.14 These guidelines ensure that:
Flow cytometry data are saved as .fcs files regardless of instrument, meaning data can be transferred and analyzed on any flow cytometry software.
One Parameter
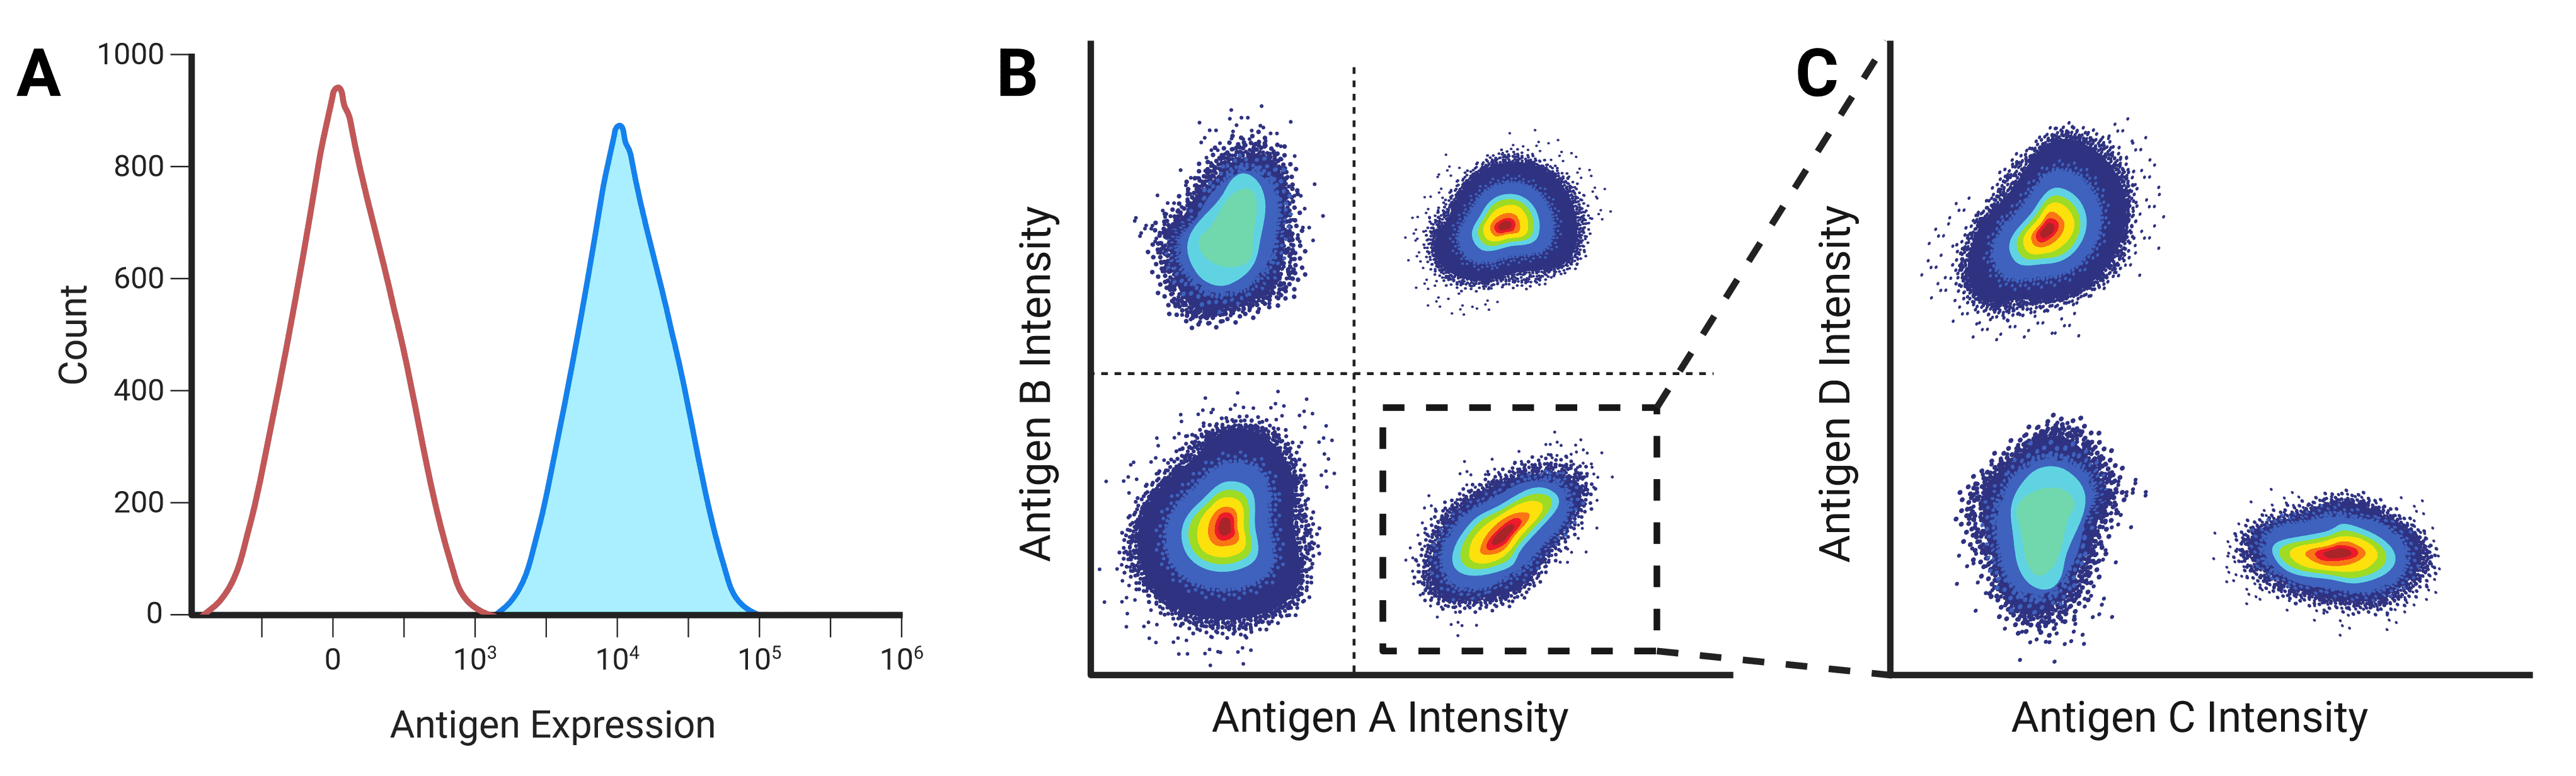
Fluorescence intensity is proportional to the amount of fluorescent label on or in a cell, either of a genetically encoded fluorescent protein, or binding by a fluorescently labeled antibody. This intensity can be plotted on the x-axis of a histogram against the number of cells or events on the y-axis to show the frequency and distribution of events (Figure 12). A negative population will reveal itself as a large number of events with very low intensity, while a positive population will contain events with significantly higher fluorescence.
Figure 12: One and two parameter displays of flow cytometry data. A, One parameter plots can be used to separate populations based on the expression of a single antigen, with negative populations appearing on the left of the plot. B, Two parameter plots identify populations by the combinatorial expression of two antigens. C, Plots can be gated so that only specific populations are investigated further. In this example, the population that expresses Antigen A highly is gated to further separate the population based on Antigen C and D expression.
Two Parameter
While multiple histograms can be overlaid, dot plots are a more common presentation method when measuring multiple parameters (Figure 12). Each axis shows the intensity of one parameter, and each dot corresponds to one event. Pseudocolor or density plots are similar to a dot plot, but using color to show where lots of events have similar intensity profiles and so overlay on the dot plot. Contour plots show the same data but using contour lines in place of dots, with each line corresponding to a defined percentage of events.
Gating Strategies
Gates are fundamental to flow cytometry analysis and are used to isolate and quantify different populations of cells with common characteristics such as FSC, SSC and fluorescence intensity.
On histograms, gates are drawn on a peak to identify the percentage of cells expressing a marker of interest.
On dot plots or density plots, gates are most commonly quadrants or shapes (rectangles, ovals, polygons). Quadrants are an intuitive way to show single-positive or double-positive populations, while shapes are useful for more complex situations such as high- and low-expressing populations.
Gates are often used sequentially to limit data display and to define ever more specific population subsets. For example, cells that are positive for antigen A, then antigens A and B, then antigens A, B and C etc. Gates can use Boolean logic (e.g. AND, OR, NOT) to link gates together and cell types.
Dead Cells and Doublets
Dead cells and doublets are populations that researchers would typically like to exclude from further analysis. Identifying doublets is particularly important for cell sorting, cell cycle analysis and DNA analysis. There are various strategies available, including:
Backgating
Backgating is a method for visualizing a cell population that is identified in one gate on plots looking at different parameters. This is particularly useful when studying a new sample type or a new gating strategy that needs to be verified.
In general, sequential gating strategies begin with FSC and SSC, then doublets and dead cells are excluded, before finally moving on to ever more specific fluorescent markers. This approach will not always be possible though when working with solid tissues that produce a lot of debris, or with cells with unknown scatter properties. In these instances, it can instead be best to use specific fluorescent markers to find the population, and then use backgating to visualize that population on an FSC x SSC plot, adjusting detection settings if needed. The location of the population on the scatter plot can then be used with more confidence in future studies.
A major application of flow cytometry is to isolate cells based on their physical characteristics for further downstream study.
Cell sorters are specialized flow cytometers that characterize and separate out cell populations according to set criteria. Separation is usually based on fluorescent reporter or antigen expression measured in regular flow cytometry, though sorting itself requires extra components in the flow cytometer.
Principles of Cell Sorting
The principles of cell sorting are initially very similar to the principles of flow cytometry. Cells in suspension move through the flow cytometer and are interrogated by one or more lasers to determine the extent of antibody binding or reporter expression. Based on their expression characteristics, a computer automatically determines whether a given cell meets the sorting criteria.
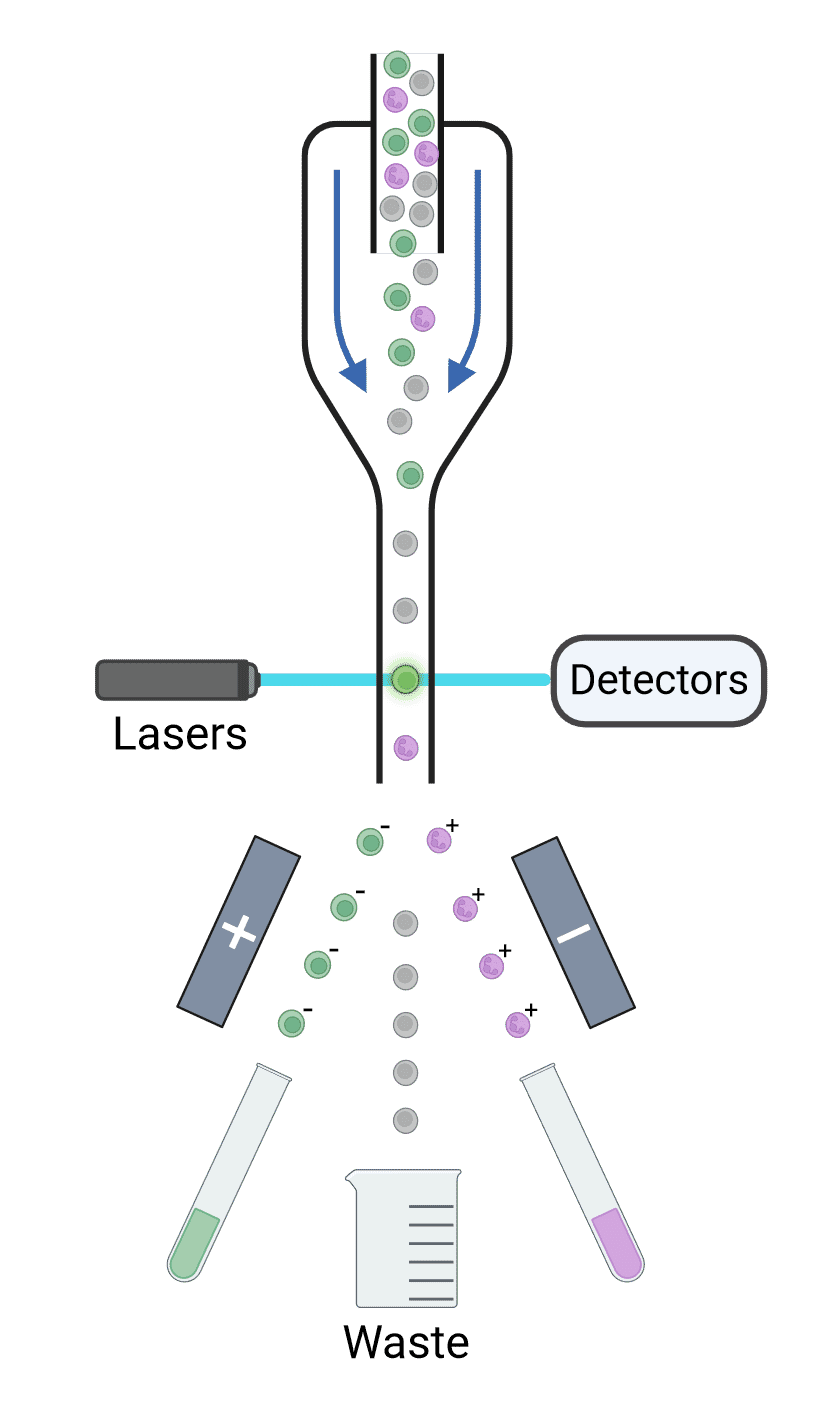
The stream of cells is ultimately broken up into droplets, each of which contains a single cell. Droplets are formed using high-frequency vibrations created by passing an electrical current across a piezoelectric crystal. Each droplet is given an electrical charge depending on the fluorescence measured for that cell (Figure 13). For example, GFP+ cells may be given a negative charge while RFP+ cells may be given a positive charge. Deflection plates in the cytometer expose the charged cells to a strong electromagnetic field, causing the cells to move towards or away from the plates depending on their charge and into collection tubes. Uncharged particles will be sent to a waste container. Sorted cells can then be cultured or analyzed by PCR, functional assays, proteomics, microscopy and so on.
Figure 13: Principles of cell sorting. Cells are interrogated by lasers, and their scatter and fluorescence are detected and analyzed. If those signals reach certain criteria, the droplets containing the corresponding cell is given a charge as they exit the nozzle. Deflection plates guide charged droplets to their appropriate collection points with an electrostatic field, while uncharged droplets go to waste collection.
The time between laser interrogation and the point at which the droplet breaks off, called the drop delay, is essential to ensure that the appropriate charge is given to the correct cell. The flow rate and the stability of the break off point are therefore critical for successful sorting.
Improving Yield, Purity and Viability in Cell Sorting
Cells are not guaranteed to survive the sorting procedure. Below are some tips to consider when performing sorting to optimize cell viability:
Spectral Flow
Traditional flow cytometers typically assign one detector per fluorophore, channeling fluorescent light of different wavelengths to the detectors using dichroic mirrors and filters. In contrast, spectral flow cytometry is a newer technology where the full emission spectra from all fluorophores are detected and analyzed by an array of detectors.15 The spectrum of each fluorophore is recognized and recorded as a spectral signature, which can then be used to differentiate it from other detected fluorophores.
The primary advantage of spectral flow is that it enables researchers to use larger panels of antibodies for flow cytometry (>40),16 because spectral flow is able to separate highly overlapping fluorophores. To distinguish these fluorophores from each other, spectral flow uses spectral unmixing rather than compensation in traditional cytometers.
Mass Cytometry
Mass cytometry is another method for combining the single cell resolution of flow cytometry with the ability to measure a large number of parameters with high precision.17 Instead of fluorophores, antibodies are labeled with heavy-metal isotopes, which can then be measured by time-of-flight mass spectrometry. The larger the isotope, the longer it will take to reach the detector.
In addition to it being possible to measure a large number of parameters with mass cytometry, the nature of metal isotopes vs fluorophores means that there is minimal spillover compared to traditional flow cytometry. However, sample acquisition is slower, sorting is impossible due to the sample preparation requirements, and analysis can be time consuming.
Imaging Flow Cytometry
Imaging flow cytometry combines flow cytometry with microscopy for high-throughput imaging of individual particles. Like flow cytometry, particles in suspension flow through the cytometer and are interrogated by lasers. Rather than PMT or photodiode detectors, fluorescent images are typically collected by one or more charge-coupled device (CCD) cameras. Though the number of fluorophores that can be used with imaging flow cytometry is more limited than traditional flow cytometry, multiple spectrally distinct images can be captured at the same time to facilitate analysis of multiple parameters.
Imaging flow cytometry can now image more than 10,000 particles per second with 10 colors (plus lightfield and darkfield) at a magnification of 10x-60x.18 Rapid imaging is made possible by the fast imaging rates of CCD cameras and time-delayed integration, meaning image acquisition occurs at the same rate as cell flow velocity.18 There is, however, a trade-off between acquisition speed and image quality. Higher flow rates necessitate some binning of pixel data, reducing the spatial resolution of the resulting images.
Fluorescent signals acquired by the CCD camera require separation by compensation to accurately assign signal to the correct fluorophore in spite of inevitable crosstalk.18,19 The spatial element of imaging flow cytometry creates additional complexity for compensation compared to traditional flow cytometry, requiring compensation at the level of individual pixels. Like in flow cytometry, calculating compensation requires single-color controls to measure spillover for each marker into other channels. One significant advantage of imaging flow cytometry is that highly overlapping fluorophores can be detected in the same spectral challenge if they are spatially distinct, such as being located in the nucleus vs the cytoplasm.
Imaging flow cytometry is suited to biological questions that contain a spatial component but still require high throughput, such as detecting the amount of a specific protein present in the nucleus of a rare cell population in a heterogeneous sample. Applications include measuring the extent of nanoparticle uptake by cells by looking at intracellular puncta, detecting local calcium signaling, and morphology analysis of cell populations.
A major disadvantage of imaging flow cytometry is that repeated, time-lapse imaging of the same cell is not possible; it provides only a snapshot of cellular markers and activity. Cell sorting by imaging flow cytometry is also not available on many imaging cytometers, requiring a combination of high-speed imaging and automated image analysis (usually using machine learning) combined with sorting capabilities. However, these systems have recently become commercially available.
Diagrams created with BioRender.com.